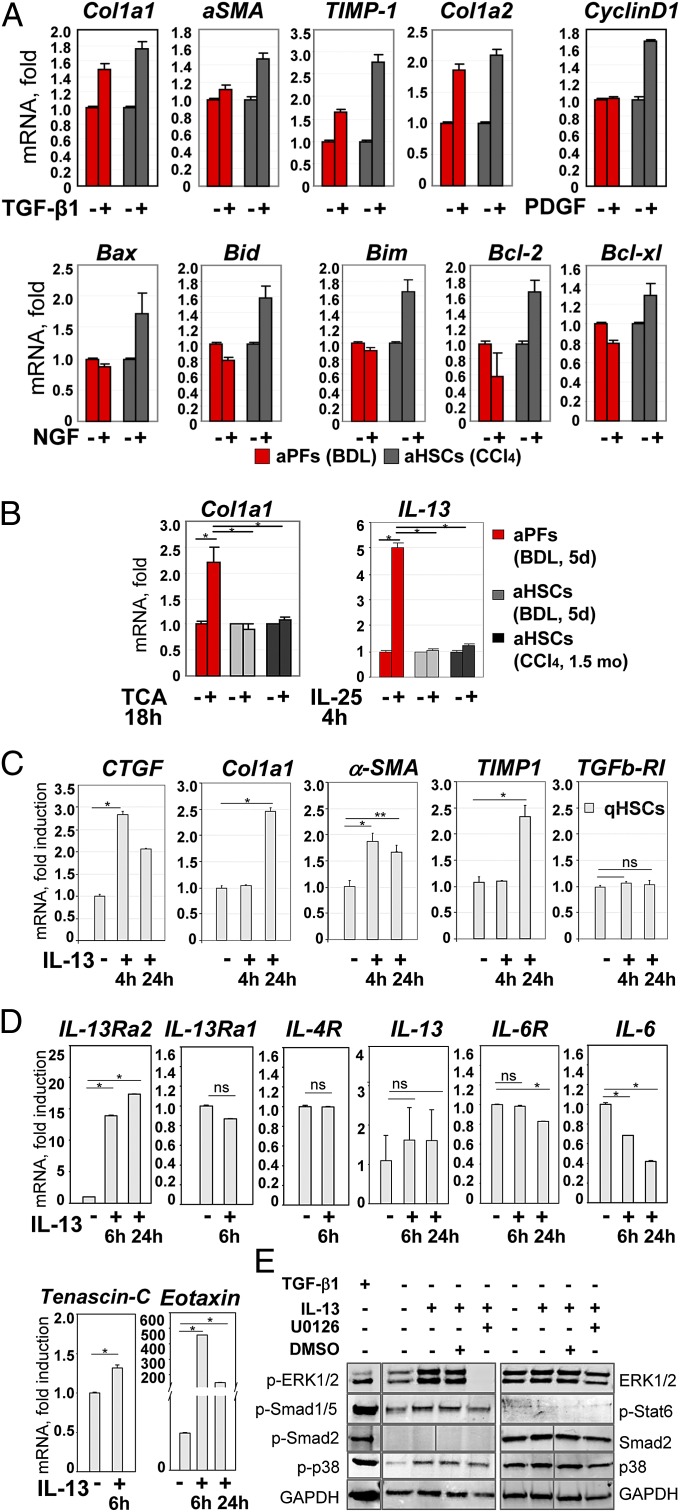
Fig. 4.
Functional properties of aPFs and aHSCs. (A) Response to cytokines was compared in BDL-aPFs and CCl4-aHSCs. Both aHSCs and aPFs responded to TGF-β1 (10 ng/mL). aHSCs, but not aPFs, responded to PDGF (100 pg/mL) and NGF (100 ng/mL). The data are fold induction compared with untreated aPFs (or aHSCs), P < 0.01. (B) BDL-aPFs (but not BDL-aHSCs or CCl4-aHSCs) responded to bile acid taurocholic acid (TCA; 1,200 nmol/mL) by up-regulation of Col1a1, and to IL-25 (100 ng/mL) by IL-13 secretion, P < 0.05. Stimulation of aPFs with Tauro-ursodeoxycholate (TUDCA; 25 nmol/mL), deoxycholic acid (DCA; 0.1 nmol/mL), taurochenodeoxycholate (TCDCA; 60 nmol/mL), Tauro b-muricholate (TbMCA; 2,000 nmol/mL), and cholic acid (CA; 20 nmol/mL) did not result in Col1a1 induction. The data are fold induction compared with untreated aPFs (or aHSCs), *P < 0.05. (C) The effect of IL-13 on HSC activation was evaluated. qHSCs were incubated with IL-13 (100 ng/mL) for 4 h and 24 h. Gene expression was evaluated by RT-PCR, *P < 0.01; **P < 0.02; ns, nonsignificant. The data (A–C) represent three independent experiments. For each experiment, the cells were isolated from three mice. (D) IL-13 signaling in mouse HSCs: IL-13–stimulated HSCs (100 ng/mL, 6 h) up-regulate IL-13Rα2, tenascin C, and eotaxin, but do not express IL-13 or IL-6, as shown by RT-PCR. (E) IL-13 signaling in HSCs (2 h) causes phosphorylation of ERK1/2 (which is blocked by ERK inhibitor U0126, 10 μM), p38, and Smad1/5, as shown by Western blot. TGF-β1–stimulated HSCs served as a control.

