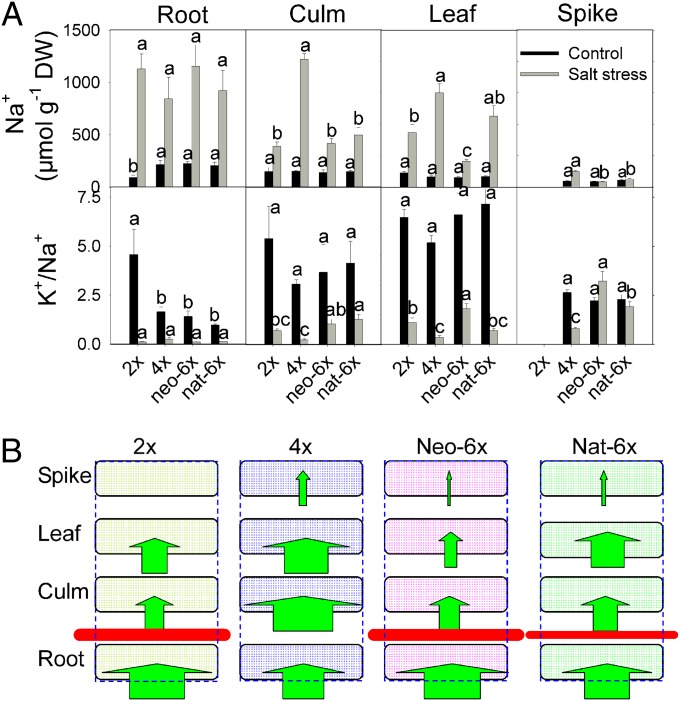
Fig. 2.
Effects of salt stress on the Na+ content, K+/Na+ ratio, and Na+ influx among organs in the neo-6x, its diploid (2x), and tetraploid (4x) parents, and nat-6x. To take these measurements, the seedlings for all genotypes were first grown under normal conditions for 30 d and then subjected to salt stress (150 mM NaCl) for 32 d (type II stress). The values are means (±SE) of four biological replicates, and each replicate consisted of a pool of five plants. (A) Na+ content and K+/Na+ ratio; means followed by different letters among genotypes of the same treatment are significantly different according to LSD (P < 0.05). (B) Na+ influx among organs under salt stress; green arrows indicate Na+ influx. The width of arrows denotes relative concentrations of Na+ in a given organ, according to data in Fig. 2A. The horizontal red bars denote Na+ retention by roots, and difference in retention capacities of the individual genotypes was depicted by the relative thickness of the bars.

