Figure 2.

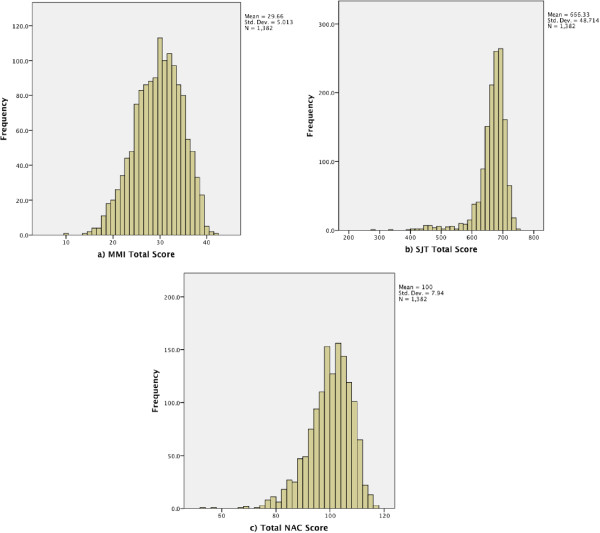
Histograms of the raw score distribution of; panel a) MMI Total Score (max = 46), panel b) SJT Total Score (max score = 800), and panel c) Total NAC Score (max= 120).

Histograms of the raw score distribution of; panel a) MMI Total Score (max = 46), panel b) SJT Total Score (max score = 800), and panel c) Total NAC Score (max= 120).