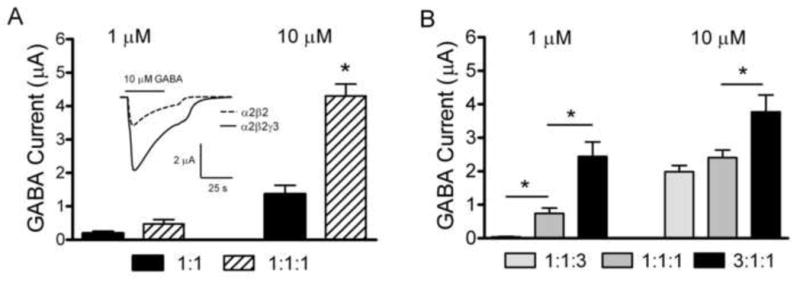
Fig. 1.

GABA currents as a function of the ratio of α2, β2 and γ3 subunit mRNAs A. Peak current amplitudes in response to 1 or 10 μM GABA in oocytes injected with a 1:1 ratio of α2:β2 subunit mRNAs or a 1:1:1 ratio of α2:β2:γ3 subunit mRNAs. Inset depicts representative inward GABA currents in response to 10 μM GABA. The solid line above the traces indicates GABA application. B. Peak current amplitudes in response to 1 or 10 μM GABA in oocytes injected with either 1:1:3 or 1:1:1 or 3:1:1 ratios of α2:β2:γ3 subunit mRNAs. The data are shown as the mean ± SEM. * indicates a significant difference between groups (p < 0.05).
