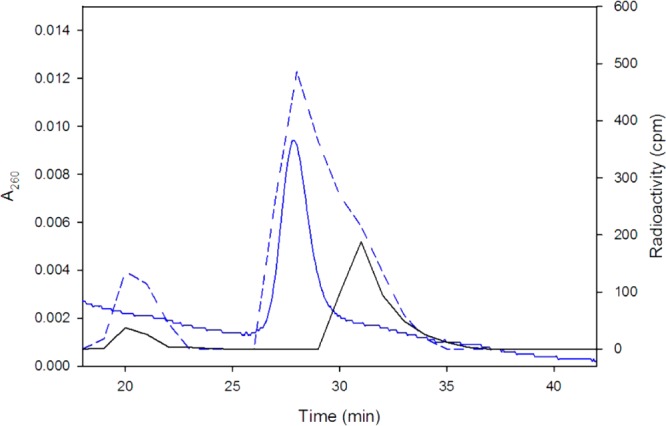
Figure 1.

Typical HPLC and radioactivity profiles of the reaction between [3H]-sT-PhaCRe (20.0 μM) and HBCH2CoA and a control reaction. The experiment in the presence of HBCH2CoA at 15.0 mM is shown in blue solid and dashed lines for A260 nm (left Y-axis) and radioactivity (right Y-axis), respectively. The control in the absence of HBCH2CoA is shown as a black solid line for radioactivity.
