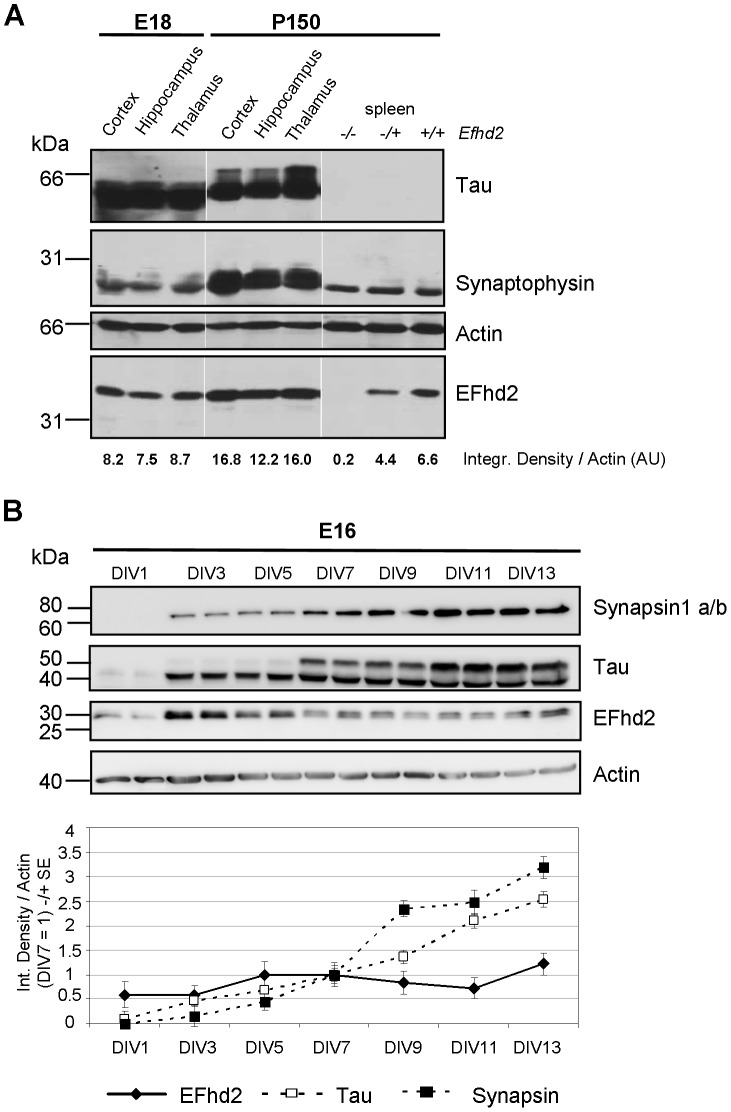
Figure 2. EFhd2 protein expression in embryonic and adult brain regions as well as in cortical neurons.
(A) Embryonic (E18) and adult brains (P150) of wildtype mice were dissected into indicated regions. These regions as well as spleens from adult EFhd2−/−, −/+ and +/+ mice were lysed and lysates were subjected to 10% SDS-PAGE, followed by western blotting with polyclonal antibodies indicated on the right. Molecular mass standards are indicated on the left (kDa). Optical densities of EFhd2 bands were normalized to actin bands. Representative of three experiments. (B) Cultures of E16 cortical neurons were cultured for the indicated days in vitro (DIV) and lysed. Each time point is represented by two lanes showing two independent cultures. Lysates were subjected to 10% SDS-PAGE, followed by western blotting with antibodies indicated on the right. Molecular mass standards are indicated on the left (kDa). Optical densities of synapsin1a/b, tau and EFhd2 bands were normalized to actin (n = 8 from 4 experiments; one representative experiment is shown). Data are represented as mean −/+ SEM.

