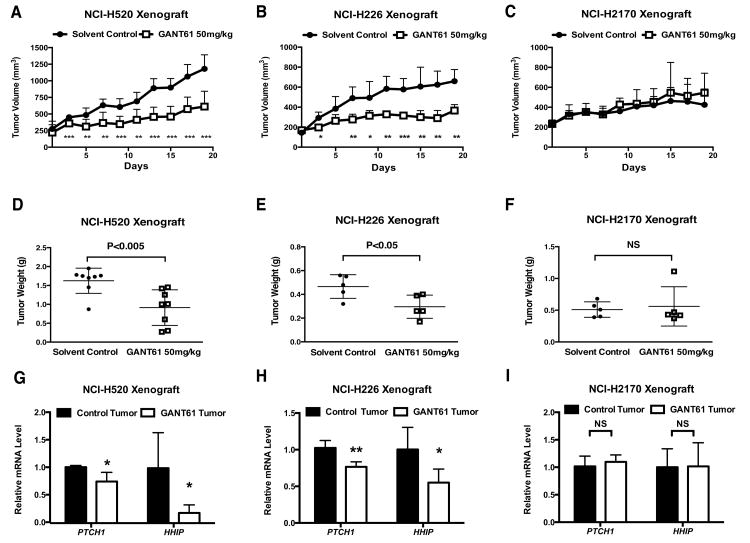
Figure 6. GANT61 treatment suppressed GLI-positive tumor progression in vivo.
A∼C, Growth of NCI-H520 (A, n=8), NCI-H226 (B, n=5), and NCI-H2170 (C, n=5) xenografts (mean ± SD). D∼F, Measurement of tumor weight at the end of treatment for NCI-H520 (D, n=8), NCI-H226 (E, n=5), and NCI-H2170 (F, n=5). Shown is the mean ± SD. G∼I, Quantification of PTCH1 and HHIP mRNA by real-time PCR in treated tumors for NCI-H520 (G, n=4), NCI-H226 (H, n=5), and NCI-H2170 (I, n=5). Values were normalized against GAPDH. Shown is the mean ± SD of independent tumors in each group. In A∼I, data were analyzed by two-tailed t test. (*: p<0.05; **: p<0.01; ***: p<0.001, NS: not significant.)

