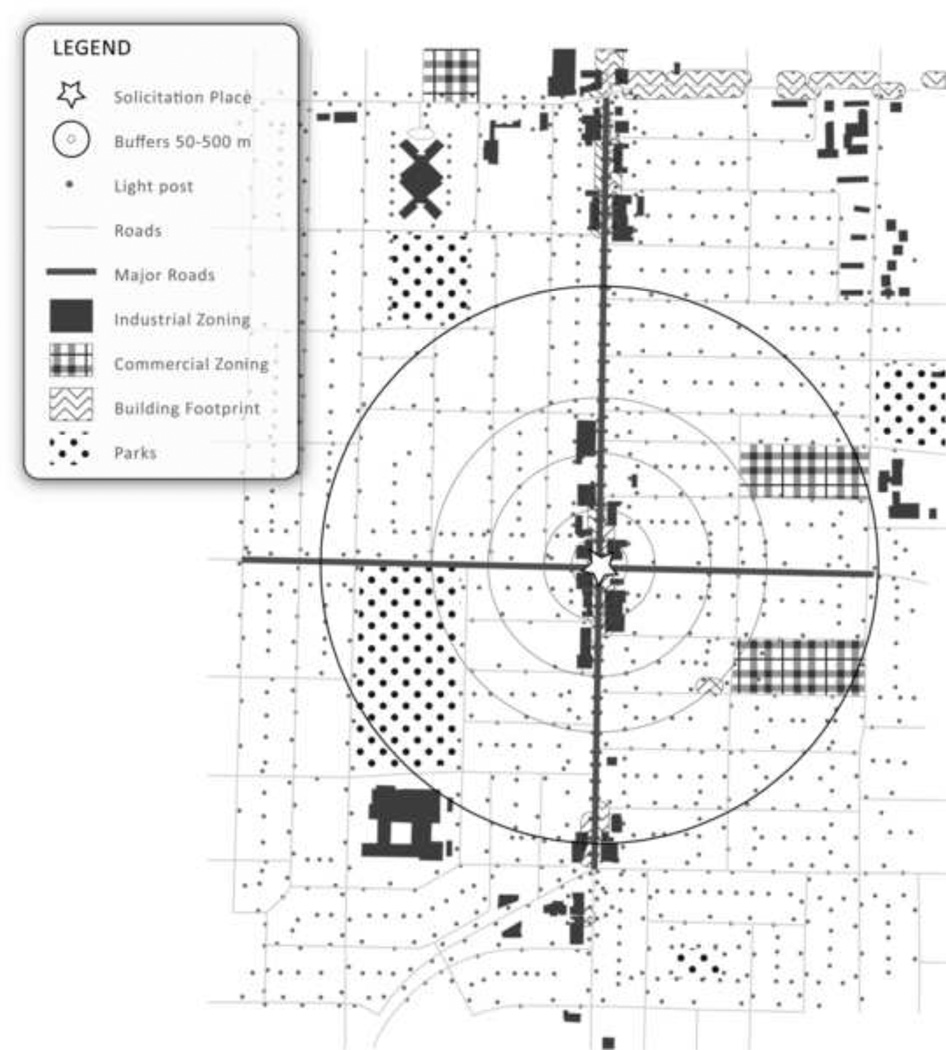
Figure 1.
Representation of how built environment indicators were derived (not an actual map of Vancouver); black dot represents sex workers’ main place of solicitation or servicing clients, with black circles representing different potential buffer sizes (the current study used 50m buffers); green squares represent parks; red squares represent commercial zoning; light green areas represent industrial zoning; yellow areas represent building footprint; red dots represent light posts. Descriptions of seven derived built environment indicators are in Table 1.

