
Figure 3. A-D. Membrane rearrangements in response to SWCNT aggregates in RBL2H3 cells.
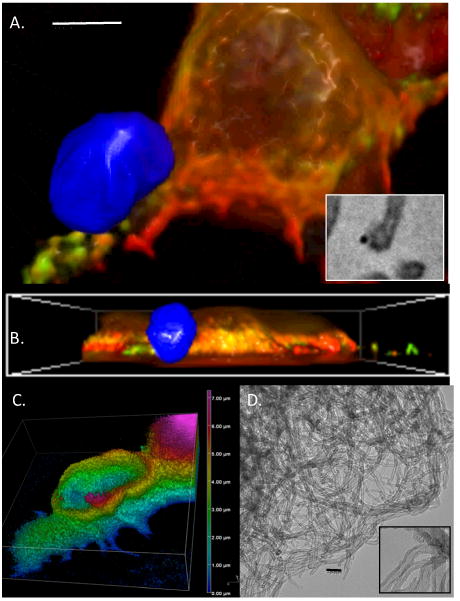
Plasma membrane was stained with Alexafluor 488-Wheat Germ Agglutinin (WGA) and exposed to SWCNT aggregates for 2 min. Images were taken at 10 min after exposure, an represent reconstructions (A) and cross-sectional (B) projections of epi-fluorescently imaged z stack (150 nm discs) sets digitally deconvolved and projected. SWCNT aggregate is false-colored blue. Scale bar in A is 2 microns. A inset shows SWCNT aggregate juxtaposed to an RBL2H3 cell process imaged by EM at 300,000×. Scale bar is 20nm. C. Z depth coding of WGA localization in immediate contact area of SWCNT aggregate. Vertical scale at right is in microns. D. EM partial view of SWCNT aggregate (120,000×) and individual fibrils (300,000× inset). Scale bar is 20nm. E-J. Analysis of cortical actin status in contact zone between CNT aggregate and RBL2H3 membrane. E. Cortical actin staining using Alexa-568 phalloidin was assessed using confocal imaging and 3D reconstruction. F. Deconvolved epifluorescence z stack projected using extended depth of focus projection, with contact zone between SWCNT aggregate and RBL2H3 highlighted. G-I. Zoomed views of control (CON, non-contact zone) and CNT contact zones (CNT) between SWCNT aggregate and RBL2H3 membrane. J. Intensity line scans of 1 micron sections of Alexa568-phalloidin fluorescence in G. Distance shown in arbitrary units.