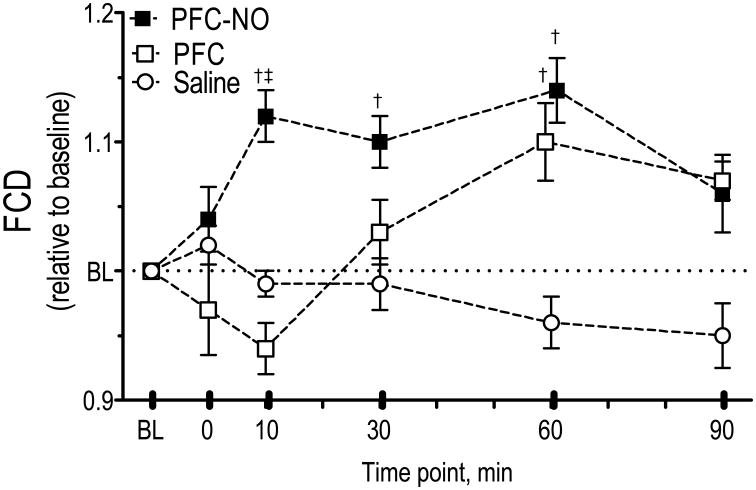
Figure 3. Functional capillary density (FCD) after infusion of PFC preloaded with NO.
PFC-NO, PFC preloaded with NO; (solid square); PFC, PFC without NO (hollow square); and Saline, volume control without NO (hollow circle). †, P<0.05 compared to saline. ‡, P<0.05 compared to PFC. FCD (cm-1) at baseline for each group were as follows: PFC (107 ± 11); PFC-NO (112 ± 10); and Saline (102 ± 7).

