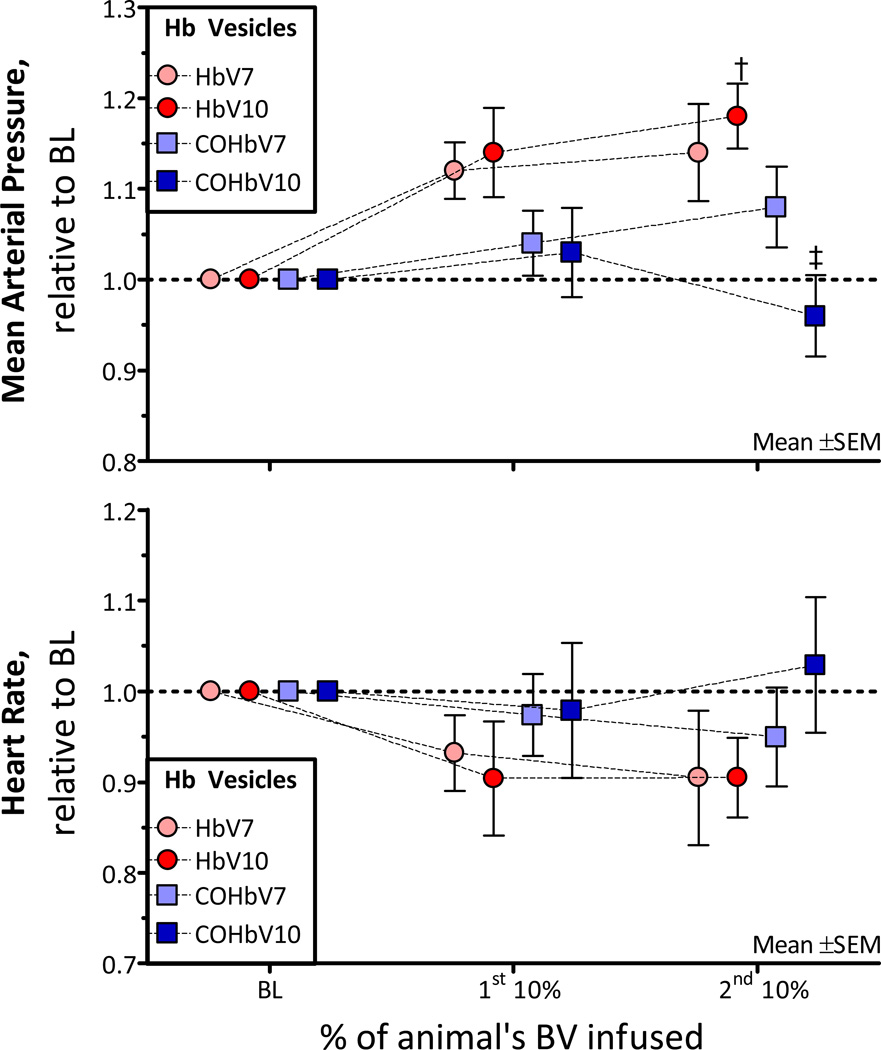
Figure 3. Relative changes from baseline in mean arterial pressure (MAP) and heart rate (HR) after infusion of HbV or COHbV solutions.
The broken line represents the baseline level. †, P < 0.05 relative to baseline; ‡, P<0.05 compared to HbV at an equal Hb concentration. A. Changes in MAP. The baseline MAP (mm Hg, mean ± SD) for each group was as follows: HbV7: 112 ± 7; HbV10: 114 ± 8; COHbV7: 110± 8; COHbV10: 109 ± 6. B. Changes in HR. The baseline HR (bpm, mean ± SD) for each group was as follows: HbV7: 432 ± 24; HbV10: 428 ± 25; COHbV7: 430± 20; COHbV10: 426 ± 21.

