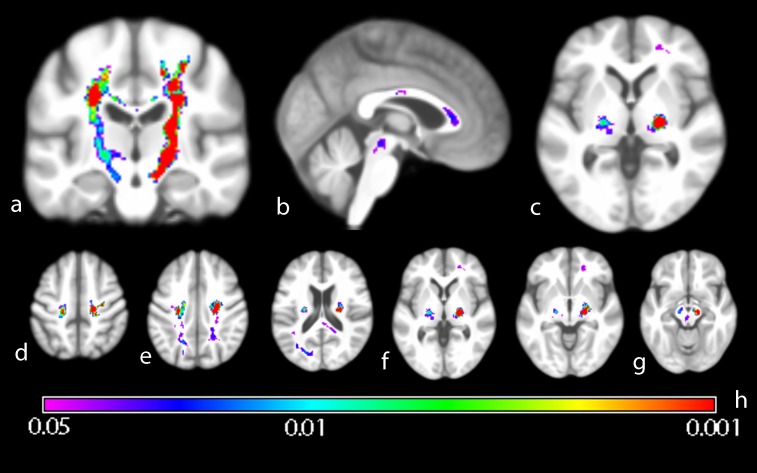
Figure 2. Group comparison of ALS patients versus healthy controls.
Wholebrain group-mean of VBI images projected on generic brain. Coronal (a), sagittal (b) und axial (c) sections illustrate significantly higher intensity in the CST, corpus callosum and posterior limb of the internal capsule (PLIC). Significant VBI increases were see descending from the motor-cortical level (d) into the cerebral peduncle, rendering areas like the radiate corona (e), PLIC (f) to the midbrain nuclei (g). Inference was done using Threshold Free Cluster Enhancement (10000 permutations) und Family-wise error rate correction for multiple comparisons. Color spectrum gives p-value indication (h).

