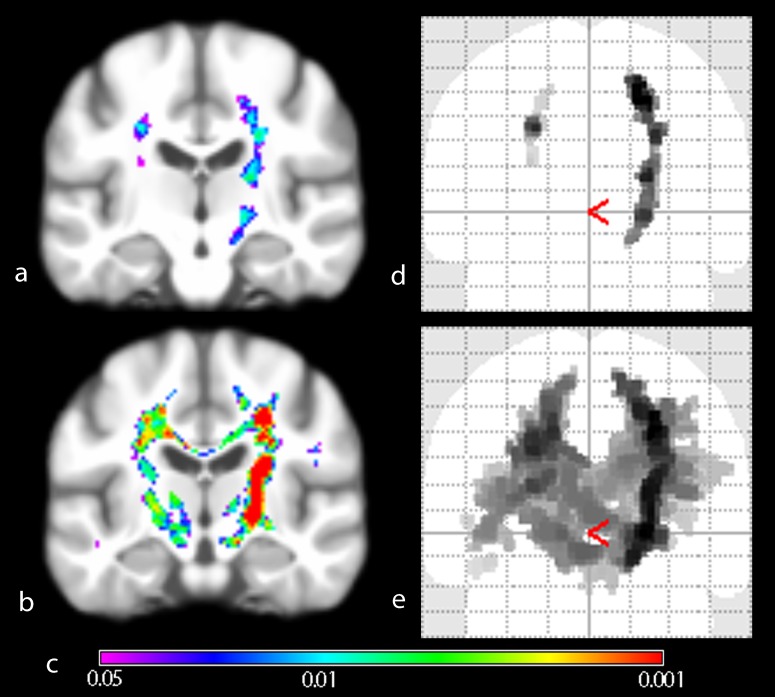
Figure 3. Group comparison of ALSFRS-R stratified patient subgroups versus healthy controls.
Wholebrain group-mean of VBI images projected on generic brain (a, b) and Maximum Intensity Projection of significantly different regions (d, e). The extent of MRI intensity change in ‘low’ disability group (a, d) is significantly less widespread than in the ‘high’ disability group (b, e). Inference was done using Threshold Free Cluster Enhancement (10000 permutations) und Family-wise error rate correction for multiple comparisons. Color spectrum giving p-value indication (c).

