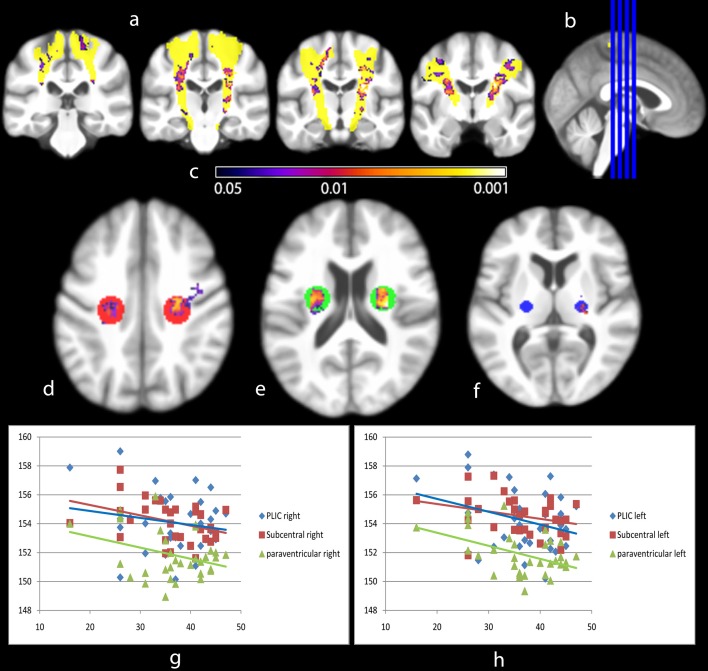
Figure 4. Regression analysis of VBI-processed T1 intensities of all ALS patients and their ALSFRS-R.
Clusters of significant correlation between VBI intensity and ALSFRS-R scores are given in coronal slices (a, level at b). Projection on VBI group mean generic brain, CST highlighted according to JHU DTI atlas (yellow). Mean intensity inside ROIs in the PLIC (f, 5 mm sphere), paraventricular (e, 10 mm sphere) and subcentral white matter (d, 10 mm sphere) reveals overall decrease in intensity (mean VBI intensity versus ALSFRS-R; g, right; h, left). This illustrates a disability-related MRI intensity change in ‘core’ regions of ALS-related white matter disturbances. Inference was done using Threshold Free Cluster Enhancement (10000 permutations). Color spectrum giving p-value indication (c).

