
Figure 7. Intron length density plots.
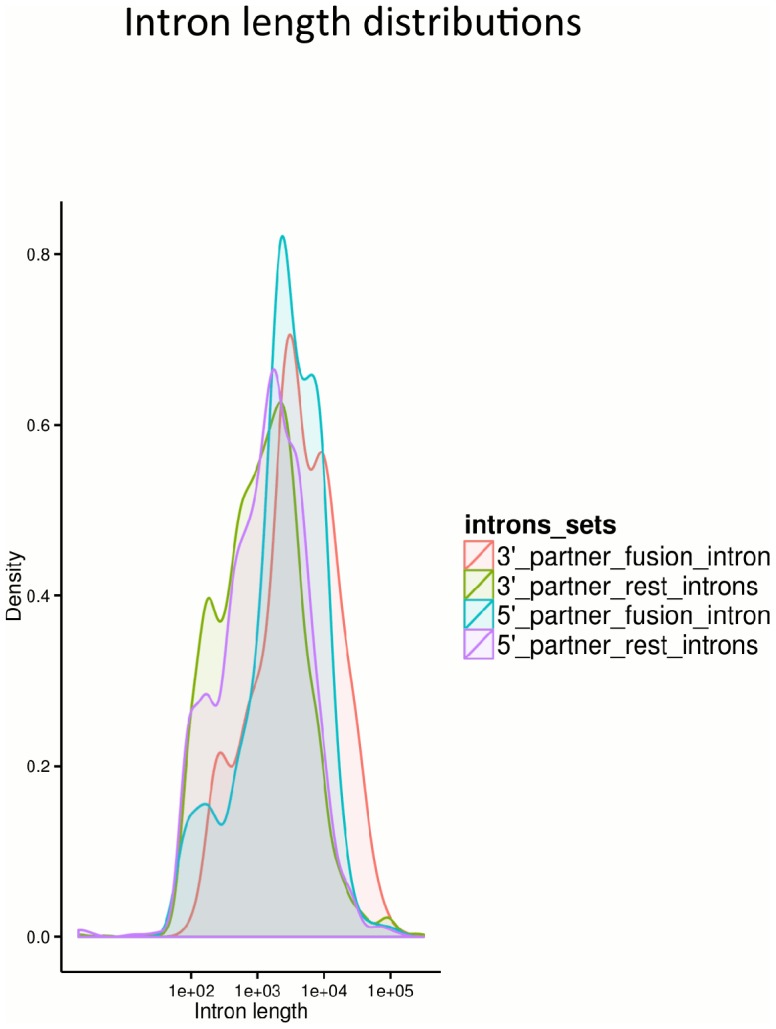
Density plots showing the distributions of the fusion 5′ and 3′ introns length versus the length of the rest of the introns comprising the fusion partner genes. Observed is a notable higher proportion of larger introns at the breakpoint.