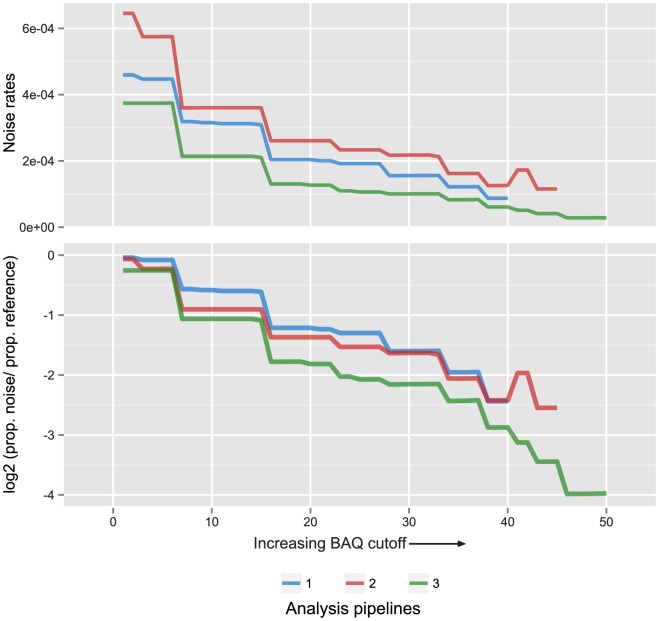
Figure 2. Base alignment quality filtering to reduce noise.
A) The noise rate in background samples for analysis pipelines 1)–3) as the base alignment quality (BAQ) cutoff is increased. Rate is defined here as total number of mutant reads/(total number of mutant reads+the total number of reference reads) in the background samples at mutated positions. B) The log2 ratio of (proportion of mutant reads)/(proportion of reference reads) left by increasing BAQ cutoffs in the background samples at mutated positions. Colors scale according to analysis pipelines. Pipeline 1) BAQ limited to 40, as qualities were not altered. Pipeline 2) BAQ limited to 45 through merging of overlapping reads. Pipeline 3) BAQ limited to 50 by merging reads and also accounting for concordance between PCR duplicates originating form the same starting molecule.

