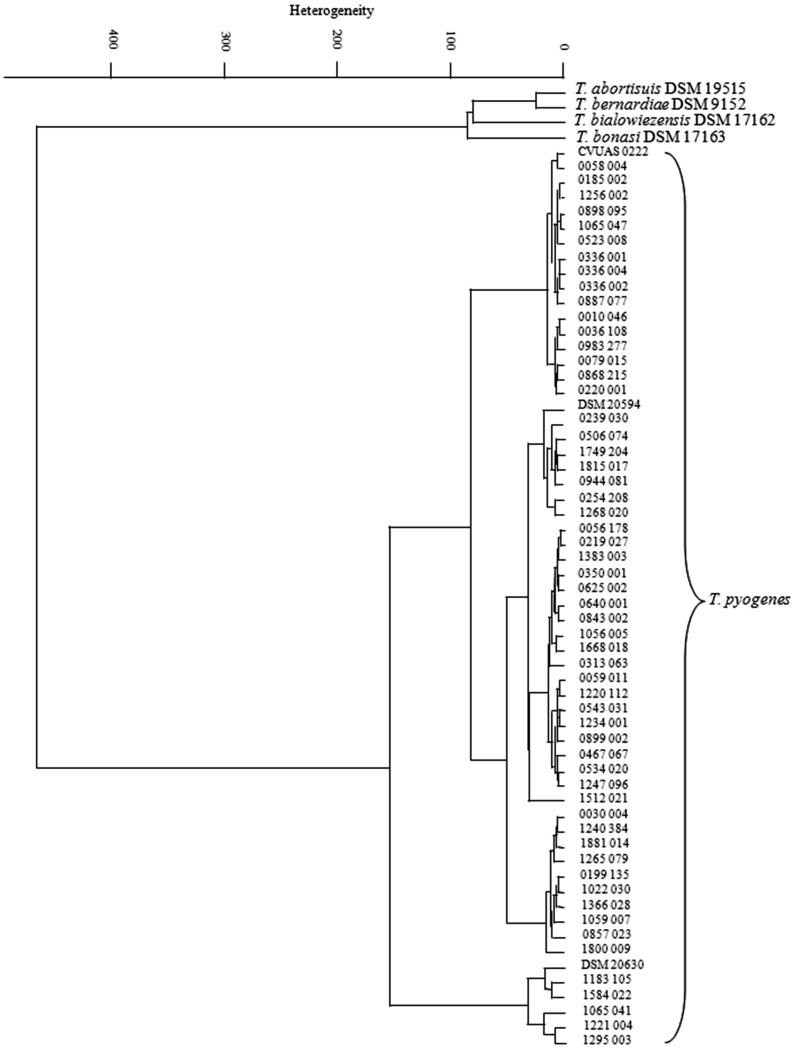
Figure 1. Dendrogram of infrared spectra of 57 T. pyogenes isolates from milk samples in comparison with reference strains from the same genus.
Cluster analysis was performed by using the second derivatives of the spectra in the spectral ranges of 500 to 1200 cm−1 and 2800 to 3000 cm−1. Ward's algorithm was applied. The arrows show three independent isolates from the same cow.

