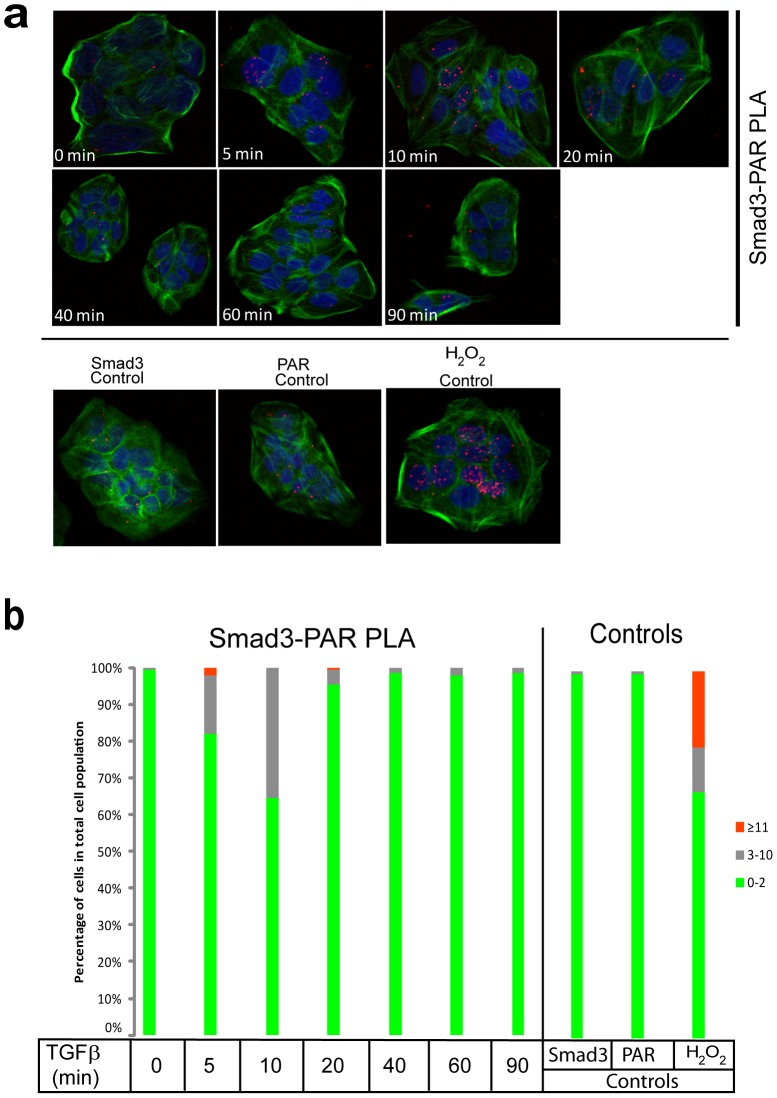
Figure 1. PLA of endogenous Smad3 ADP-ribosylation after TGFβ stimulation in HaCaT cells.
(a) HaCaT cells were analyzed with PLA using antibodies against Smad3 and PAR chains after stimulation with vehicle (0 min) or with 2 ng/ml TGFβ1 for the indicated time periods. Specific RCA signals were detected in the nuclei. Cells stimulated with 10 mM hydrogen peroxide for 10 min served as positive control. PLA with single antibodies against Smad3 or PAR are shown as controls. PLA signals are shown in red, blue is DAPI staining for DNA and green is phalloidin staining for the actin cytoskeleton as a measure of overall cell architecture. (b) Quantification of the experiment shown in panel (a) using the DuolinkImageTool, with data plotted as a histogram divided in three classes according to the percent of cells that exhibit specific RCA signals: very low, 0–2 signals per cell [green]; low, 3–10 signals per cell [grey]; and high, >11 signals per cell [red]. The figure shows a representative experiment from three or more repeats.

