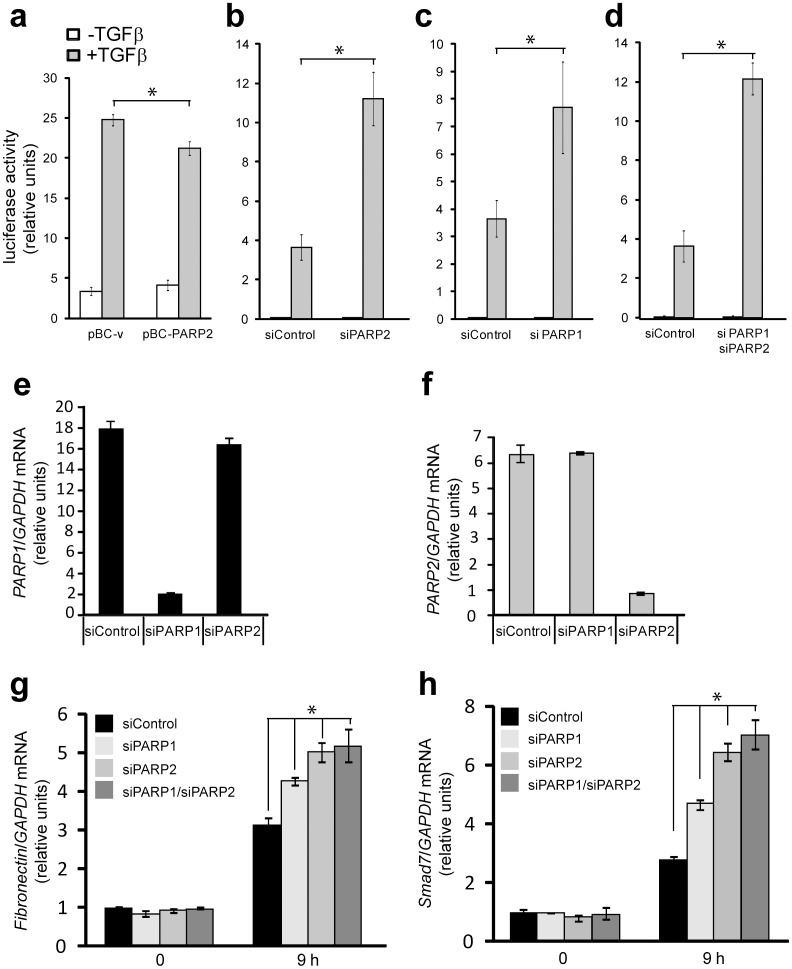
Figure 7. Regulation of gene expression by PARP-1 and PARP-2 during TGFβ signaling.
(a) CAGA12 promoter luciferase assay in HaCaT cells transiently transfected with pBC-vector (pBC-v) and pBC-PARP-2 and stimulated (grey bars) or not (white bars) with 5 ng/ml TGFβ1 for 24 h. Average values with standard errors of luciferase activity normalized to the corresponding co-transfected β-galactosidase activity from triplicate determinations are shown based on a representative single experiment. (b–d) CAGA12 promoter luciferase assays were performed as in panel (a) in HaCaT cells transiently transfected with the indicated siRNAs 48 h prior to stimulations with TGFβ1. Stars (panels a–d) indicate statistical significance relative to the Control condition stimulated with TGFβ1, p<0.05. (e, f) Quantitative real-time RT-PCR assays for PARP-1 (e, black bars) and PARP-2 (f, grey bars) in HaCaT cells after transient transfection with control and specific siRNAs. The specific mRNA amounts were normalized to the expression level of the housekeeping gene GAPDH and are expressed as relative fold-differences. Average values from triplicate determinations are shown with standard deviations as error bars. (g, h) Real-time RT-PCR analysis of endogenous fibronectin (panel g) and Smad7 (panel h) mRNAs normalized to the corresponding GAPDH mRNA from human HaCaT cells transfected with the indicated siRNAs and left unstimulated (0 h) or were stimulated with 2 ng/ml TGFβ1 for 9 h. Average values from triplicate determinations and the corresponding standard errors are graphed. Stars (panels g, h) show statistical significance relative to the siControl condition stimulated with TGFβ1, p<0.05. The figure shows representative experiments from four or more repeats.

