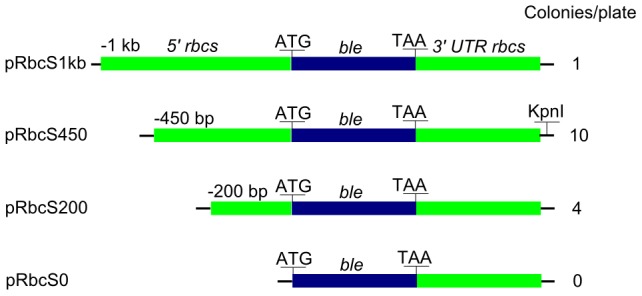
Figure 1. Schematics of the LiRbcS transformation constructs and corresponding average number of resultant colonies per plate.

The number of colonies is the average of 12 different transformation events. The blue boxes represent the ble coding sequence, and the green boxes represent the LiRbcS promoter and terminating sequence. KpnI restriction site used in Southern blot hybridization is marked on the construct that was used for L. incisa transformation.
