
Figure 1. Timeline illustrating the experimental period.
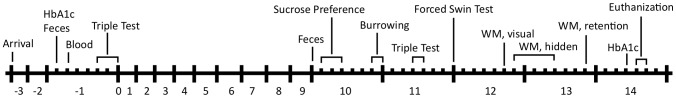
Numbers indicate week number, with mice subjected to the experimental diets from time 0. HbA1c: Glycosylated hemoglobin 1c, WM: Water Maze.
Official websites use .gov
A
.gov website belongs to an official
government organization in the United States.
Secure .gov websites use HTTPS
A lock (
) or https:// means you've safely
connected to the .gov website. Share sensitive
information only on official, secure websites.
Numbers indicate week number, with mice subjected to the experimental diets from time 0. HbA1c: Glycosylated hemoglobin 1c, WM: Water Maze.