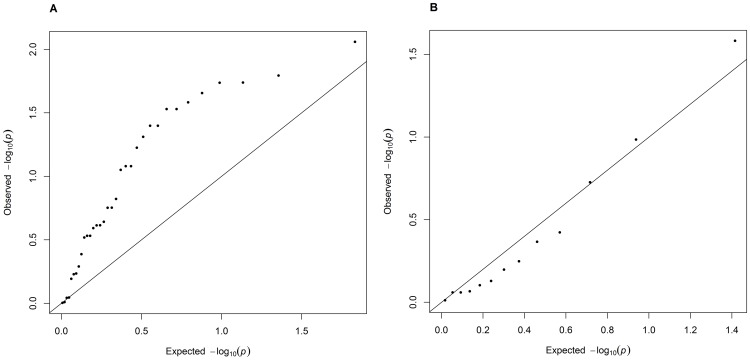
Figure 2. QQ Plots for SNVs Previously Associated with Baseline BMI.
QQ plots for the 47 SNVs previously reported as associated with body mass index that we interrogated (A) SNVs that have a directionally consistent effect with previous literature (n = 35) show an inflation in the p-values calculated for this study, whereas the QQ plot of our p-values for SNVs that are directionally inconsistent (B) (n = 13) are consistent with the null hypothesis.

