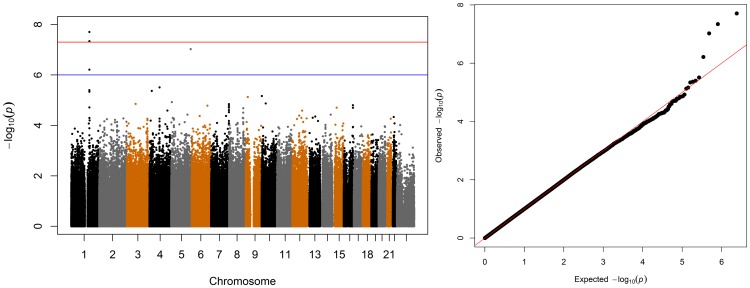
Figure 3. Manhattan and QQ Plots of Change in BMI Over 2 Years.
A signal at chromosome 1, and inflation in the tails of the QQ plot indicate an association between SNV rs347313 and change in BMI over 2 years in females. This SNV is in the intron of NOS1AP. The suggestive threshold is drawn at 10−6, and the genome wide significance threshold is drawn at 5·10−8.

