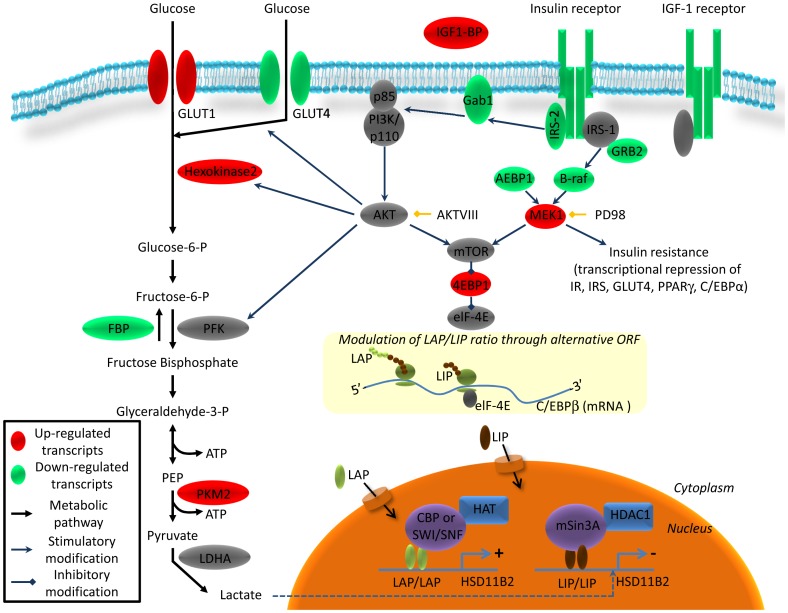
Figure 4. Schematic representation of the insulin pathway and its regulation by sustained insulin stimulation in HT-29.
mRNAs were quantified 24 h after insulin (10−7 M) treatment using RT2 Profiler PCR Arrays PAHS-30C. Up-regulated transcripts are shown in red and down-regulated transcripts are shown in green.

