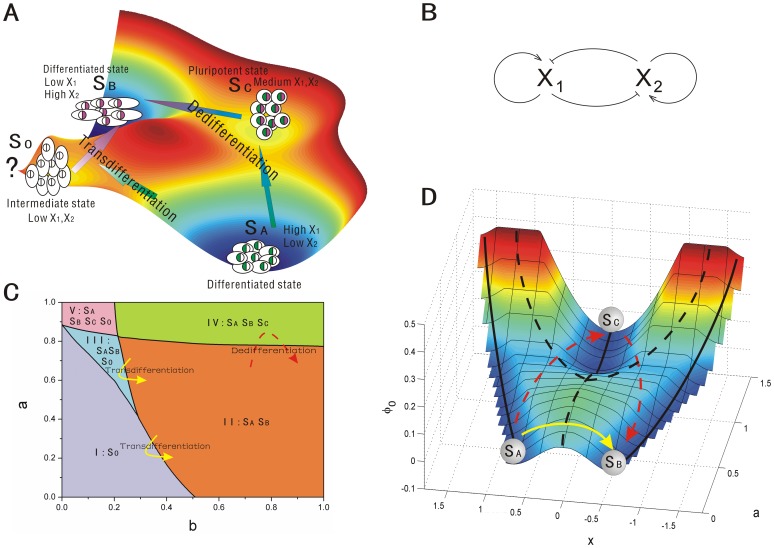
Figure 1. The scheme, phase diagram and intrinsic potential landscape of cell type switchings.
A: The scheme of dedifferentiation (including reprogramming and differentiation) and transdifferentiation. B: A model for the gene circuit for cell development. C: The phase diagram for the gene circuit with  . D: The cell fate landscape
  obtained from the Hamilton-Jacobi equation versus
  and
and  , and the phase diagram was drawn on the intrinsic potential landscape with stable states represented by black solid lines and unstable states represented by black dash line. The red dash lines represent the dedifferentiation(reprogramming) and redifferentiation process while the yellow solid lines represents the transdifferentiation process. (
 ,
,  ,
,  .)
.)

