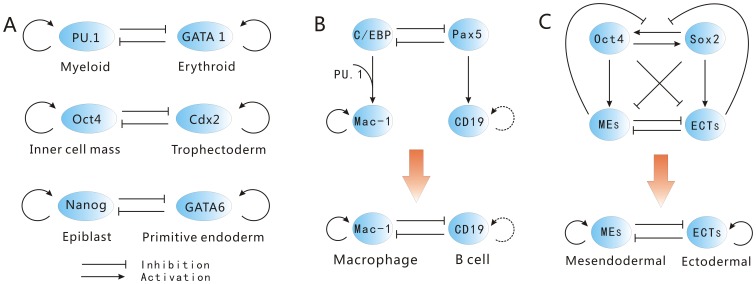
Figure 2. The gene circuits of mutual antagonism and self activation.
A: The interaction of  and
and  in determining myeloid cell or erythroid cell,
  and
and  in determining inner cell mass or trophectoderm,
  and
and  in determining epiblast or primitive endoderm. B: Scheme for the gene circuit of B cell to macrophage conversion. The dashed lines indicate uncertainty. C: Scheme for the gene circuit in determining mesendodermal and ectodermal.

