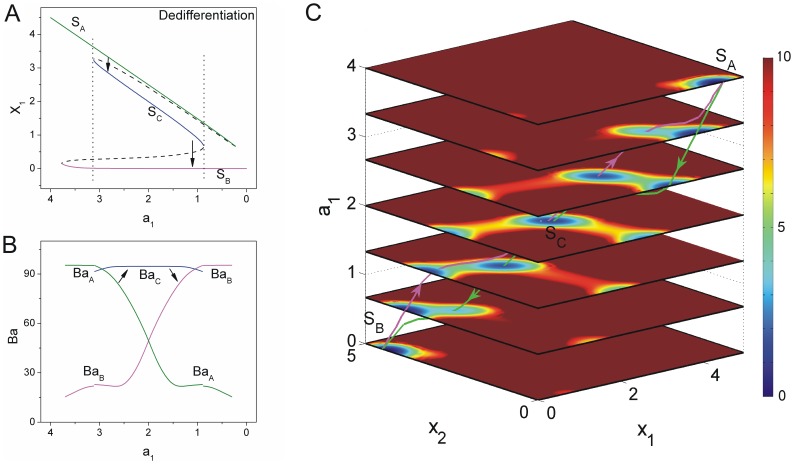
Figure 6. The dynamics of dedifferentiation undergoing a pluripotent state.
A: The phase diagram for decreasing  induced the differentiated state
  to the other differentiated state
  through the pluripotent state
  . (
. ( ,
,  ) B: The barrier heights of the population landscape versus the parameter
  . C: The quantified dedifferentiation landscape and pathways for continuous changing parameter
  .
.

