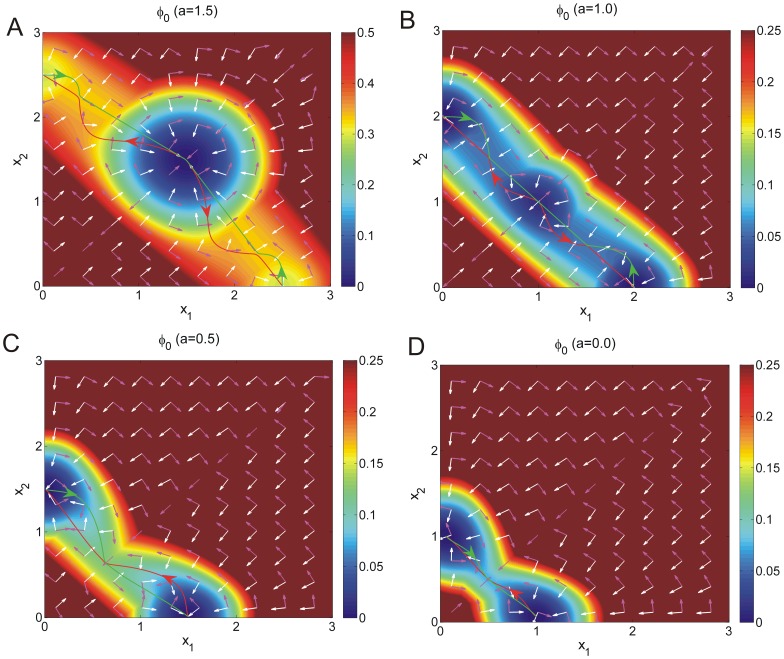
Figure 8. The paths of cell type switchings with different self activation strength  .
.
The paths of differentiation (A,B), dedifferentiation (A,B) and transdifferentiation (C,D) for different  in zero-limit fluctuations on the intrinsic potential
  . Purple arrows represent the intrinsic flux velocity (
 ) while the white arrows represent the negative gradient of intrinsic potential (
 )).
)).

