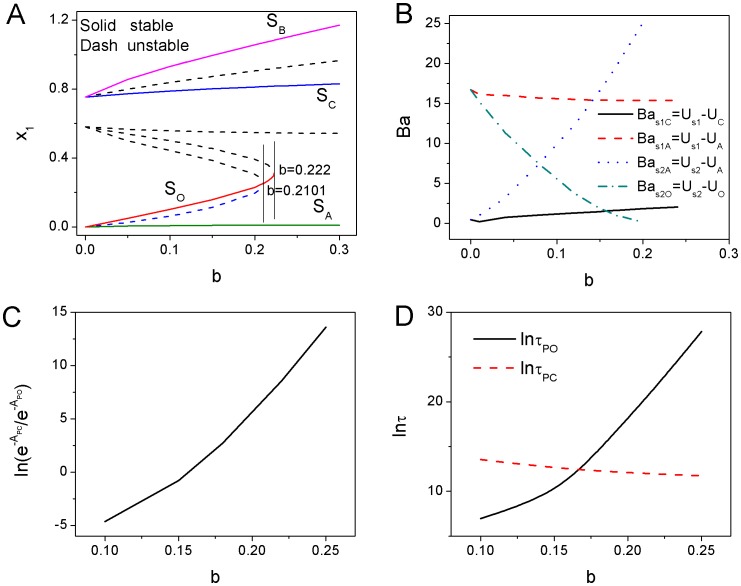
Figure 9. The phase diagram, barrier height, probability of the dominant path and mean first passaging time for different mutual repression strength  .
.
A: The phase diagram for changing mutual repression strength  with
with  . B: The barrier heights versus the parameter
  . C: The probability of the dominant path through the progenitor cell state
  divided that of the path through the intermediate state
  versus the inhibition strength
  . D: The mean first passaging time through the two paths versus the inhibition strength
  .
.

