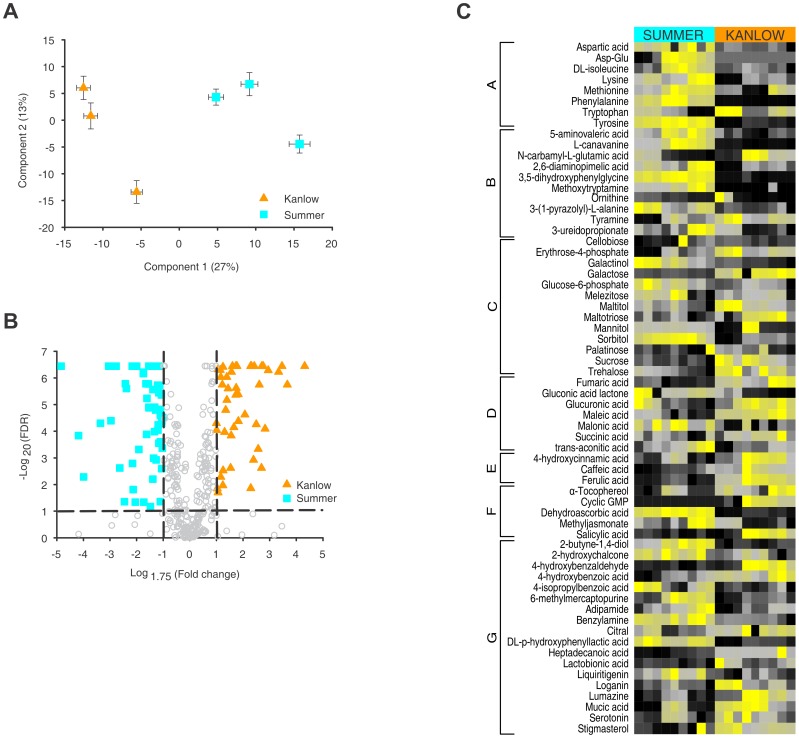
Figure 2. Metabolite profiling reveals ecotype specific differences in crown and rhizome tissues.
(A) PCA of overall metabolite profiles observed by GCMS for for each of three individual genotypes within each cultivar. Kanlow tissue extracts (orange triangles) are separated from Summer tissue extracts (cyan squares) by the first component. Two-way error bars are shown for each plant that was based on nine separate GCMS runs for each sample. (B) Volcano plot showing the log10FDR versus the log1.75 fold change in peak area for major ions for all metabolites detected by GCMS. Significant differences were observed for several metabolites between the two cultivars (Kanlow orange triangles) and Summer (cyan squares). Grey circles are metabolites that failed to show sufficient differences in ion area of had an FDR value of >0.05. (C) Heat map shows marked differences in tissue abundances of selected metabolites in Kanlow and Summer crowns and rhizomes. Data are the average of triplicate injections from each of three separate extractions from the three biological replicates of each cultivar. Scale is from high abundance (yellow) to low abundance (black) for each metabolite. Data were subjected to one-way hierarchical clustering based on cultivar, and metabolites were manually reordered into more biologically related groupings (A–G).

