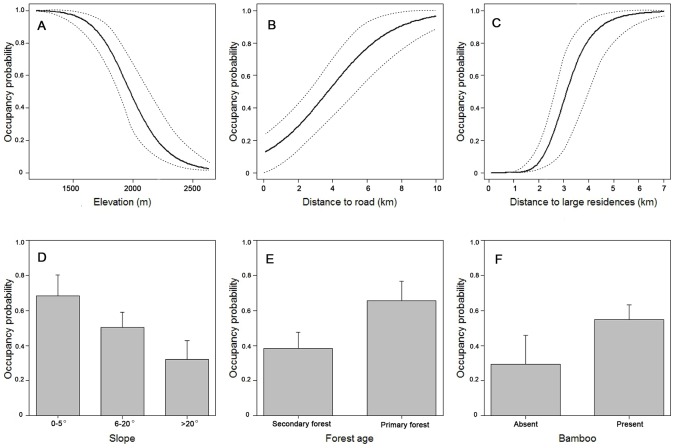
Figure 2. Partial correlation between giant panda occupancy probability and each environmental variable.
The model-averaged weights is 1.00 for elevation (A), 0.46 to distance to road (B), 1.00 for distance to large residences (C), 0.30 for slope (D), 1.00 for forest age (E), and 0.45 for bamboo distribution (F).

