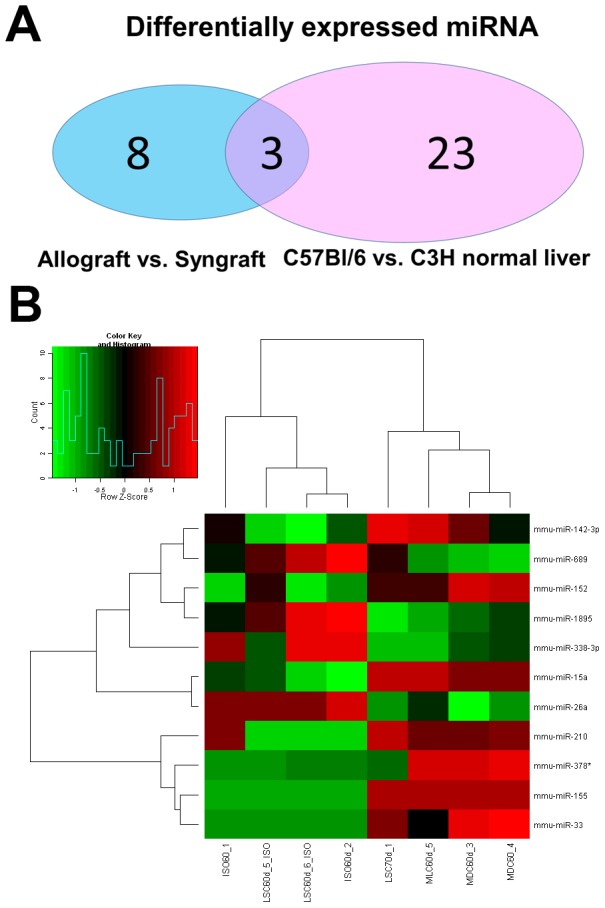
Figure 1. Expression profiles of miRNAs in allo-/syngeneic liver grafts.

A: Comparison of observed miRNA in allografts vs. syngrafts and normal C57BL/6 vs. C3H mouse liver. B: miRNA expression profile between allografts and syngrafts. Clustering of the microarray showed the statistically significant (*p<0.05) miRNAs. The columns and rows represent samples and particular miRNAs.
