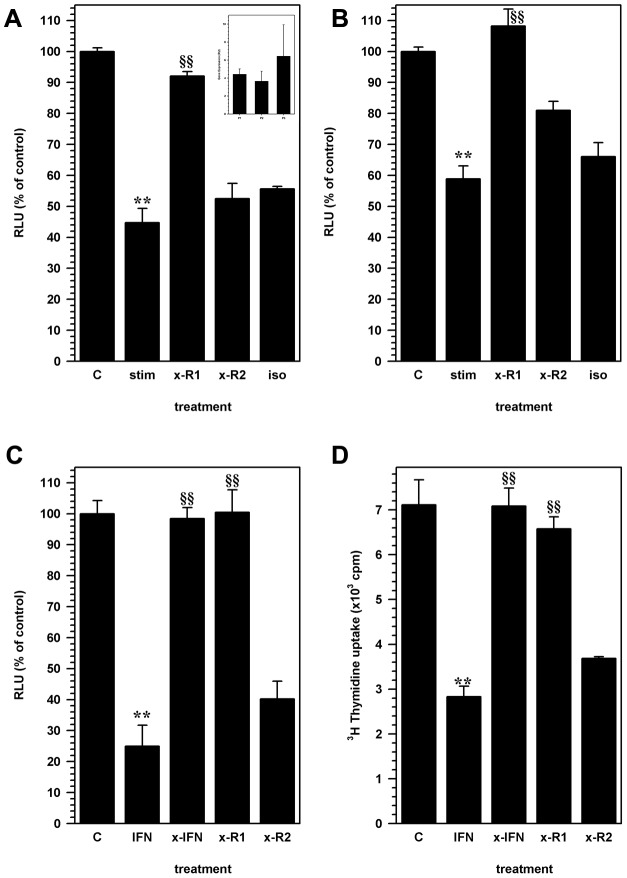
Figure 3. IFN-γ inhibition of NSC proliferation is mediated through the IFN-γ receptor.
NSC cultures were treated with antibodies to IFN-γ alpha receptor (R1) subunit (x-R1) or IFN-γ beta receptor (R2) subunit (x-R2). (A) Relative luminescence units (RLU) from untreated control NSC cultures (C) were compared to cells treated with stimulated CD8 lymphocytes conditioned medium alone (stim), or cells treated with anti-IFN-γR1 (x-R1) or IFN-γ R2 (x-R2) or isotype control antibodies along with lymphocyte conditioned medium. (inset) Relative expression (RU) of IFN-γ R1 by Real-time RT-PCR analysis in NSC for obtained from first (P1), second (P2) and third (P3) passages in culture. Data are presented as average expression from 3 cultures (assayed in triplicate) at each passage (± SEM). (B) Co-cultures of NSCs with activated CD8 lymphocytes were either untreated (stim), or treated with anti-IFN-γR1 (x-R1), IFN-γ R2 (xR2) or isotype control antibodies (iso) to determine the role of lymphocyte-derived IFN-γ on stem cell proliferation. Luminescence intensity values are compared to similar untreated NSC cultures (C) and are presented as a percentage of untreated control cells. Data presented are pooled from 3 separate experiments (mean ± SEM). (C) The specificity of the IFN-γ mediated inhibition of NSC proliferation, mediated through the IFN-γ receptor, was recapitulated using recombinant murine IFN-γ (IFN) in the NSC culture medium. Anti-IFN-γ antibody (x-IFN), anti-IFN-γR1 antibody (x-R1) or anti-IFN-γR2 antibody was used to reverse the IFN-γ effect compared to untreated NSC cultures (C). Luminescence data are presented as a percentage of RLU from similar untreated NSC cultures. (D) Thymidine uptake assay was used to measure the effect of IFN-γ treatment (IFN) on NSC proliferation. IFN-γ effect on thymidine uptake was antagonized by treating with neutralizing antibodies to INF-γ (xIFN), IFN-γR1 (x-R1) but not by antibodies to IFN-γR2 (x-R2). Graphs represent pooled data obtained from 2–5 separate experiments with treatments performed in triplicates (mean ± SEM). ** p<0.001 vs. untreated NSC and §§ p<0.001 vs. stimulated CD8 T-cell or IFN-γ treated NSC.

