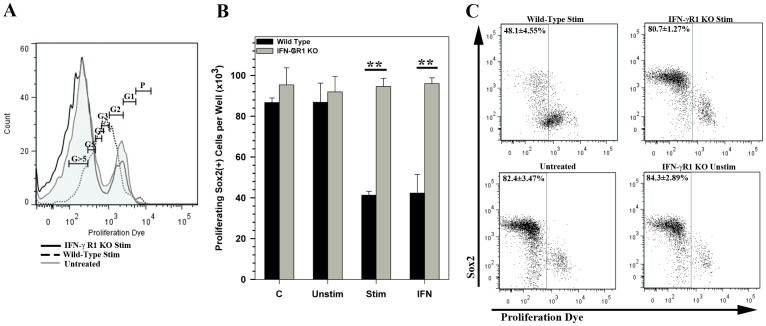
Figure 5. IFN-γR1 knockout NSCs are resistant to CD8 T-cell mediated inhibition of proliferation.
NSCs were labeled with eFluor670 proliferation dye and were cultured alone (untreated), with 20 pg/mL IFN-γ (IFN) or in the presence of unstimulated (Unstim) or stimulated CD8 T cells (Stim). (A) Representative flow histograms of stimulated CD8 T cell treated and untreated NSCs demonstrating dilution of labeling dye fluorescence corresponding to cell divisions. Gates for generation of progeny was allocated based on progressive halving of the fluorescence measured in dividing NSCs (calculated using a cell proliferation algorithm in the FlowJo software). Proliferation of IFN-γR1 KO NSCs when co-cultured with stimulated CD8 T-cells (black line) compared to untreated NSCs (untreated, gray tinted line), or wild-type NSCs cultured with stimulated CD8 T-cells (dotted line) is shown. (B) Quantification of total number of proliferating Sox2(+) NSCs in shown under each culture condition for wild type and IFN-γR1 KO NSCs. Data are presented as an average of three replicates ± SEM. ** p<0.01. (C) Representative dot plots showing Sox2 immunolabeling vs dilution of proliferation dye fluorescence observed in wild type (upper left) and IFN-GR1 KO NSCs (upper right) co-cultured with stimulated CD8 T-cells. Untreated NSC cultures (lower left) and those co-cultured with unstimulated CD8 T-cells (lower right) show no difference in proliferation or Sox2 expression. Gates are drawn to indicate cells that have undergone five to seven rounds of division (or proliferation dye dilution) post culture and the percentages of proliferating cells are presented as average ± SEM.

