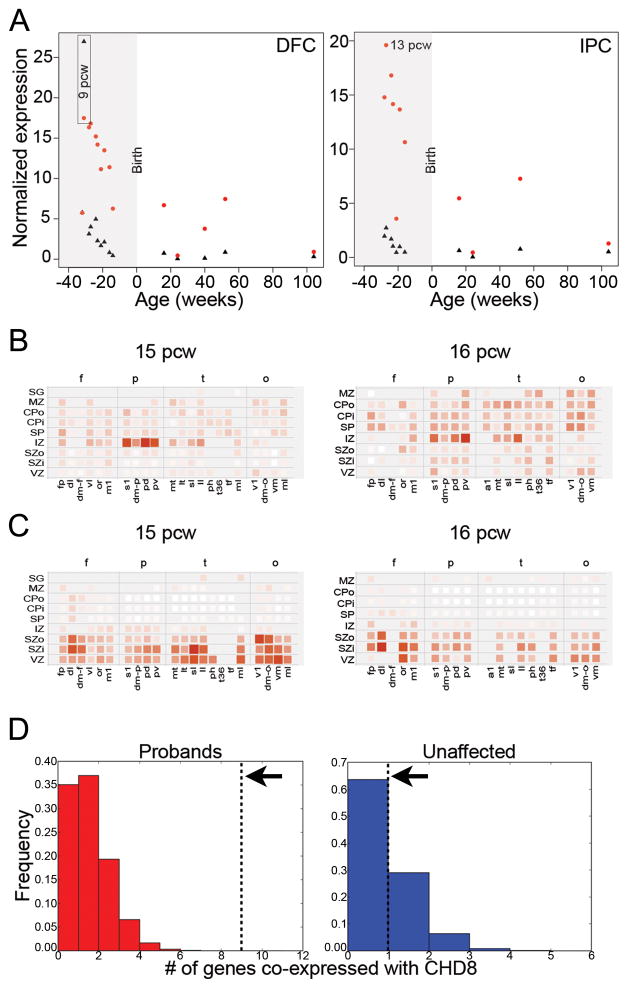
Figure 3. Normal expression of CHD8.
A) Reads per kilobase per million normalized expression values of CHD8 (red) and CHD7 (black) in dorsolateral prefrontal cortex (DFC, left) and posteroventral (inferior) parietal cortex (IPC, right) over a range from 8 post-conception weeks (pcw) to 104 weeks (2 years) of age taken from normal post-autopsy individuals. Highlighted in gray is expression in the fetal brain prior to birth.
B–C) Heatmap showing localized expression of CHD8 (B) or CHD7 (C) at 15 pcw (left) and 16 pcw (right) in the intermediate zone (IZ). Red indicates increased expression and white indicates no expression. Cortical samples are organized in columns by lobe (f=frontal; p=parietal; t=temporal; o=occipital) and in rows by layer from basal to apical surfaces of the developing neocortex (SG=suprageniculate nucleus of the thalamus; MZ=marginal zone; CPo=outer cortical plate; CPi=inner cortical plate; SP=subplate zone; SZo=outer subventricular zone; SZi=inner subventricular zone; VZ=ventricular zone). Within lobes, samples are approximately ordered from rostral to caudal. a1=primary auditory cortex; dl=dorsolateral prefrontal cortex; dm-f=dorsomedial frontal cortex; dm-o=dorsomedial extrastriate cortex; dm-p=dorsomedial parietal cortex (area 7m); fp=frontal polar cortex; il=inferolateral temporal cortex; lt=lateral temporal-occipital cortex; m1=posterior frontal cortex (motor cortex); mi-t=midinferior temporal cortex; ml=midlateral extrastriate cortex; mt=medial temporal-occipital cortex; or=orbital frontal cortex; pd=posterosuperior (dorsal) parietal cortex; ph=posterior parahippocampal cortex; pv=posteroinferior (ventral) parietal cortex; s1=primary somatosensory cortex; sl=superolateral temporal cortex; t36=(rostral) midinferior temporal cortex (area 36); tf=caudal midinferior temporal cortex (area TF); tp=temporal polar cortex; v1=primary visual cortex; vl=ventrolateral prefrontal cortex; vm=ventromedial extrastriate cortex.
D) CHD8 is co-expressed with nine genes carrying truncated mutations in ASD probands (n=133, red, left panel) and one gene carrying disruptive mutations in unaffected siblings and controls (n=58, blue, right panel) (Gulsuner et al., 2013; Rauch et al., 2012) with Pearson correlation r>0.9 (black dashed lines). For comparison, 100,000 random sets of genes of the same size (n=133, left; n=58, right) were sampled. The histogram shows the number of genes from each such random set that are co-expressed with CHD8. CHD8 is found to co-express with a significantly higher number of genes reported as sites for de novo truncated mutations in ASD probands (p<1×10⁻⁵) in contrast to unaffected siblings and controls, which was not significant (p=0.37). See also Figures S2 & S3, Tables S3 & S4.

