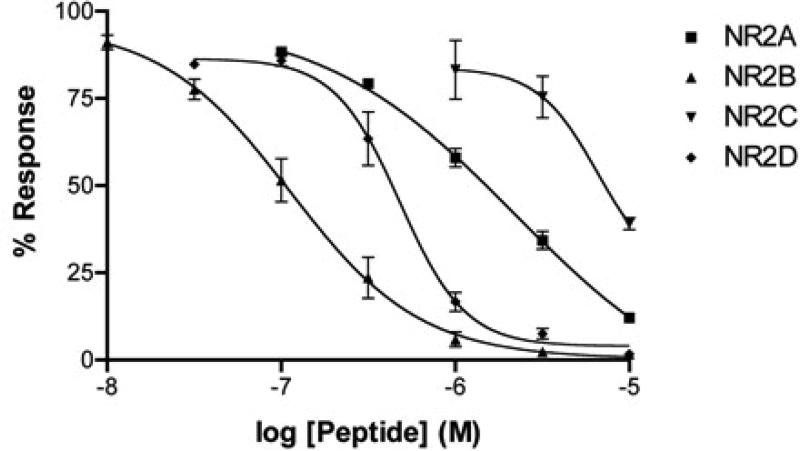
Figure 6.
Concentration-response curve of ConRl-A on the four different NR2 NMDA receptor subunits separately co-expressed with NR1-2b in Xenopus oocytes. Each data point represents the response obtained from three independent oocytes. Curve fitting was performed using Prism software (GraphPad Software, Inc.).

