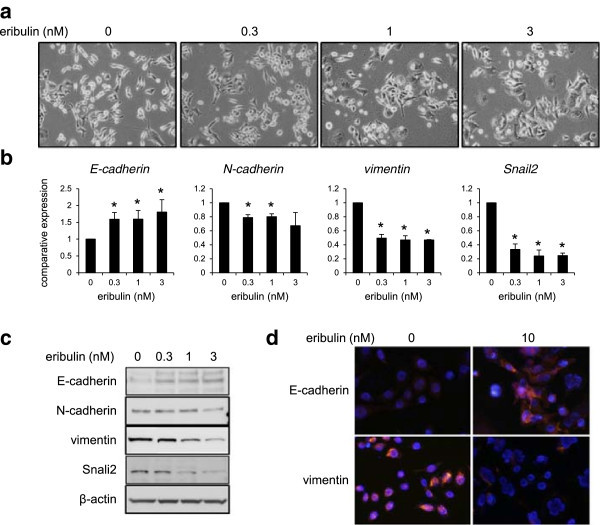
Figure 4.

Eribulin induces MET in MX-1 cells after 8 days of exposure. (a) Morphological changes of MX-1 cells after exposure to 1, 3, or 10 nM of eribulin. (b) The mRNA expression levels of E-cadherin, N-cadherin, vimentin and Snail2 were determined using real time RT-PCR. GAPDH was used to normalize the expression levels. The data shown represent the average ± SD of three independent experiments. *P < 0.05 versus control. (c) Western blotting analysis for E-cadherin, N-cadherin, vimentin, and Snail2. β-actin was used as an internal control. (d) Immunofluorescence staining of E-cadherin (red) and vimentin (red). The nucleus (blue) was stained with DAPI.
