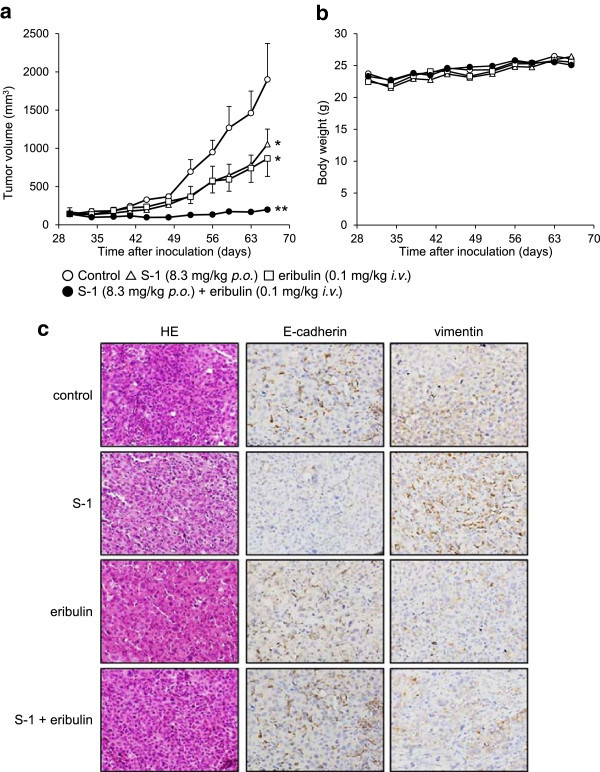
Figure 6.

Combination effects of S-1 and eribulin in an in vivo xenograft model. (a) The tumor volumes of the four groups are plotted from day 30 until day 66 after the inoculation of MDA-MB-231 cells. The data shown represent the average values (bars, SD). *P < 0.05 versus control, **P < 0.05 versus S-1 or eribulin alone. (b) Body weight loss in mice. (c) HE staining assay and IHC assays using mouse tumor samples. Tumors were collected after 7 days of treatment and the prepared tissue slides were analyzed with HE staining and IHC using anti-E-cadherin and anti-vimentin antibodies.
