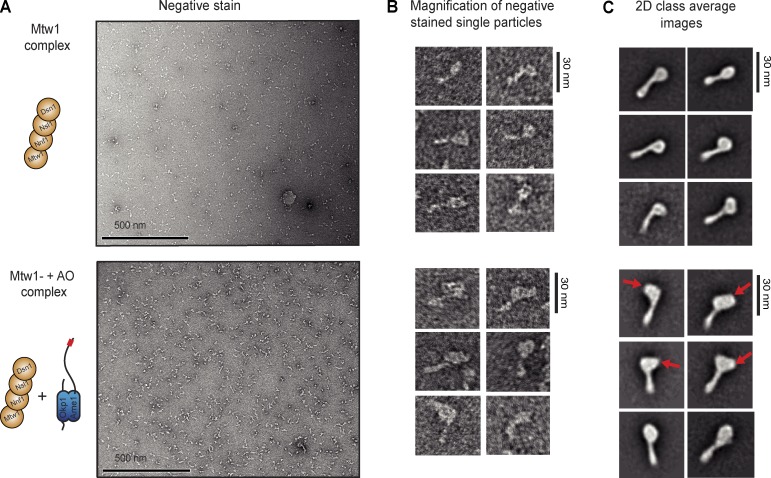
Figure 4.
Structural analysis of the hexameric Mtw1C–AO complex by single particle electron microscopy. (A) Negative-stained electron microscopy of recombinant full-length Mtw1 complex (top) or a stoichiometric combination of the Mtw1 complex and the Ame1–Okp1 complex (bottom). (B) Close-up views of individual negatively stained particles. (C) 2D class averages derived from electron microscopy images shown in A represent characteristic views of the Mtw1 complex in the absence (top set) and presence (bottom set) of the AO complex. Note the increase in size of the larger lobe of the Mtw1 complex, indicated by red arrows, and the disappearance of the central cavity.

