
Figure 3.
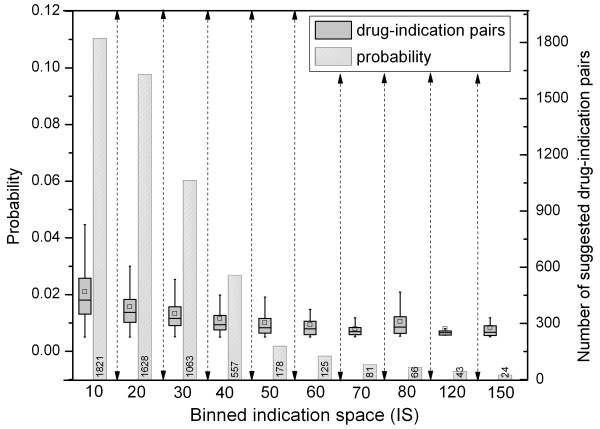
Binned 5,586 suggested pairs based on IS along with probabilities. X-axis denotes the number of indications and the bars represent the number of cases (Right-Y-axis) including drugs with that many indications. Box plots summarize the probability distribution (Left-Y-axis) of suggested drug-indication pairs.