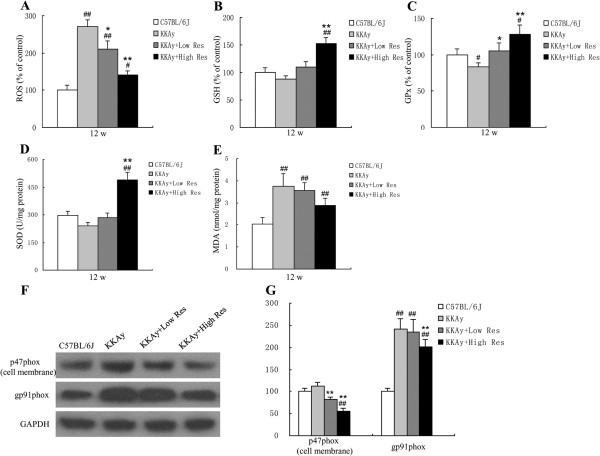
Figure 3.

Effects and mechanisms of dietary Res treatment on liver oxidative activation. (A, B, C, D, E). Hepatic levels of ROS, GSH, GPx, SOD and MDA were measured after a 12-wk study period. (F) Expression of p47phox (cell membrane), gp91phox and GAPDH in liver tissues in each group determined by Western blotting after intervention, each blot stands for at least three independent samples. (G) Quantitative analysis of expression levels, which were normalized for GAPDH. Data are shown as the mean ± S .D. #P < 0.05 and ##P < 0.01 vs. C57BL/6 J. *P < 0.05 and **P < 0.01 vs. KKAy control, n = 10.
