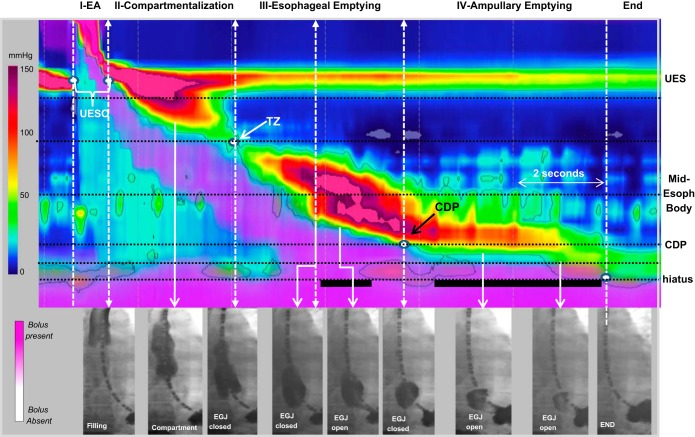
Fig. 1.
The 4 phases of esophageal bolus transit. The phases of bolus transit are presented on an esophageal pressure topography plot (EPT) with combined impedance topography in a single supine swallow using simultaneous fluoroscopic images at various time points along the swallow. The EPT plot uses standardized color scale range for pressure, and the isobaric contour (solid black line) circumscribes all pressure values above 30 mmHg. The impedance utilizes an impedance topography scale to delineate liquid (pink shading). The white dashed lines represent the temporal landmarks for the 4 phases based on landmarks [upper esophageal sphincter (UES) opening (UESO); transition zone (TZ); contractile deceleration point (CDP)] from the start and end of the swallow. The horizontal dotted black lines represent the measurement domains for the IBP derived at the nadir impedance value for each phase and also the locations for measuring the pressure-diameter relationship. In phase I (esophageal accommodation, EA) the esophagus is filling, and at the end of phase I, the bolus has not reached the distal esophagus. The lumen is filled with air in the distal region. During phase II the bolus is compartmentalized between the UES and esophagogastric junction (EGJ), which remains closed. Phase III is associated with peristalsis, and esophageal emptying may begin during phase III if a preferential pressure gradient is obtained when the EGJ is open. Flow through the EGJ is noted by the solid black horizontal lines localized at the crural diaphragm. Phase IV represents the time period after peristalsis when emptying occurs via ampullary emptying, which is a distinct mechanism from peristalsis.

