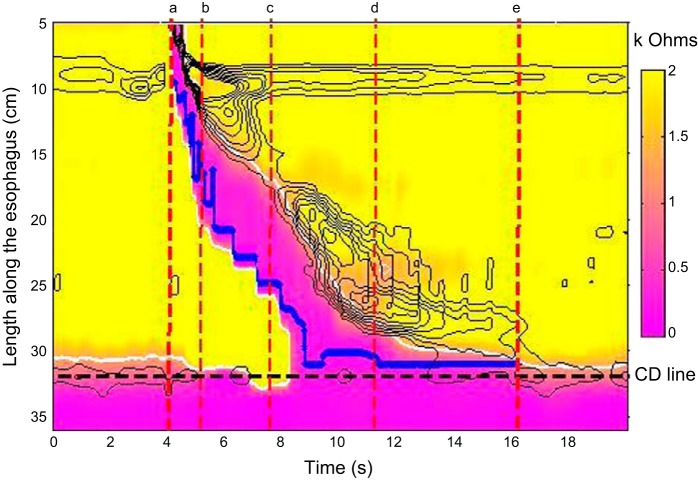
Fig. 2.
Methodology utilized to measure intrabolus pressure (IBP) during the 4 phases of bolus transit. The impedance data are plotted by impedance topography to highlight liquid presence (scale 0–2.0 kΩ). The pressure data are depicted with isobaric contour lines (black lines) and the time points for defining the various phases are highlighted by the red dashed lines [phase I (a–b); phase II (b–c); phase III (c–d), and phase IV (d–e)]. The nadir impedance (solid blue line) was plotted by using the UES, the crural diaphragm (CD), and the 30 mmHg isobaric contour as the boundaries to contain the measurement within the bolus. Pressure at the nadir impedance was used through each phase as the measure of IBP and this was referenced to simultaneous gastric pressure to highlight the pressure difference that would promote bolus transport into the stomach.

