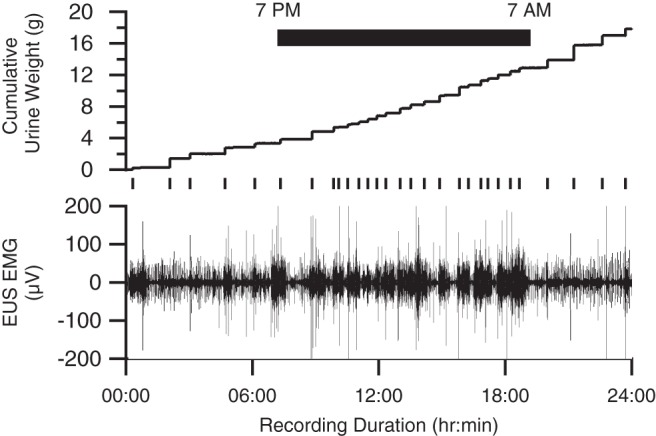
Fig. 5.

Unrectified EUS EMG (bottom trace) and urine weight (top trace) acquired during one 24-h recording session. The raster plot below the urine weight trace identifies the timing of individual voids, which are evident as steplike increases in urine weight. Intervoid intervals were shorter and void weights were smaller during the 12-h period, when the room lights were turned off (black bar) and the rat was more active, than during the 12-h light period, when the rat was less active.
