Fig. 6.
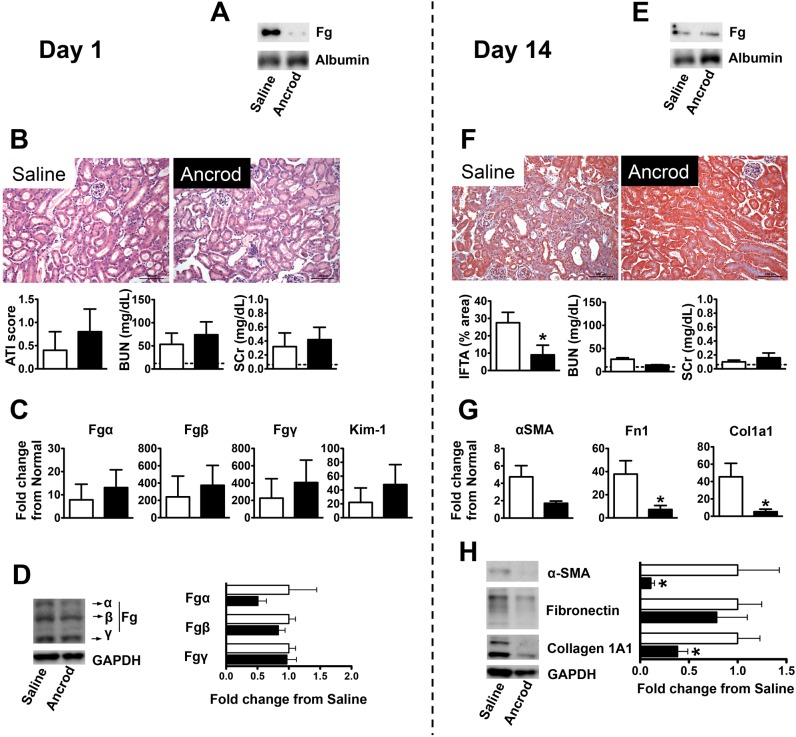
Pharmacological Fg depletion protects mice from FA-induced kidney fibrosis. The vertical dashed line separates results on day 1 after FA injection (acute kidney injury phase) from those on day 14 (kidney fibrosis phase). A: nondenaturing gel Western blot analysis showing reduced plasma Fg levels on day 1 after FA injection in mice that received a continuous peritoneal infusion of fibrinogenolytic Ancrod delivered by Alzet pumps (at a 3 U/day rate started 3 days before FA injection) compared with those that received saline vehicle. Plasma albumin was used as a loading control. B: histological (representative images of H&E-stained slides and ATI score) and biochemical (BUN and SCr) evaluation of acute injury revealing that kidneys were similarly affected 1 day after FA injection in mice that received fibrinogenolytic treatment (Ancrod) or vehicle (saline). Data are presented as means ± SE; n = 5 mice/group. The dashed line represents the mean of values in normal mice. C and D: kidney mRNA (C) and protein (D) expression (selected immunoblots and quantification) of Fgα, Fgβ, Fgγ, or Kim-1 were not significantly affected by the treatment. Quantitative PCR data were normalized to GAPDH. Data are presented as means ± SE of fold changes from normal mice. Western blot data were normalized to GAPDH and are shown as means ± SE of fold change from saline treatment; n = 5 mice/group. E: by day 14 after FA injection, plasma Fg levels were low and similar for mice that received a continuous peritoneal infusion of Ancrod or saline vehicle, as shown by nondenaturing gel Western blot analysis. The Alzet pumps ensured delivery of the drug up to day 11 after FA injection. Plasma albumin was used as a loading control. F: Ancrod treatment conferred significant protection from FA-induced kidney fibrosis after 14 days, as indicated by MTS (representative images shown and overall estimation of tissue area presenting interstitial fibrosis and tubular atrophy graphed). Plasma biochemical parameters (BUN and SCr) had reduced levels at this time point regardless of treatment. Data are presented as means ± SE; n = 5–6 mice/group. *P < 0.05 compared with saline treatment. The dashed line represents the mean of values in normal mice. G and H: Ancrod treatment resulted in reductions in kidney mRNA (G) and protein expression (H) of the fibrosis markers α-SMA, Fn1, and Col1A1. Quantitative PCR data were normalized to GAPDH. Data are presented as means ± SE of fold changes from normal mice. Western blot data were normalized to GAPDH and are shown as means ± SE of fold changes from saline treatment; n = 5–6 mice/group. *P < 0.05 compared with saline treatment.

