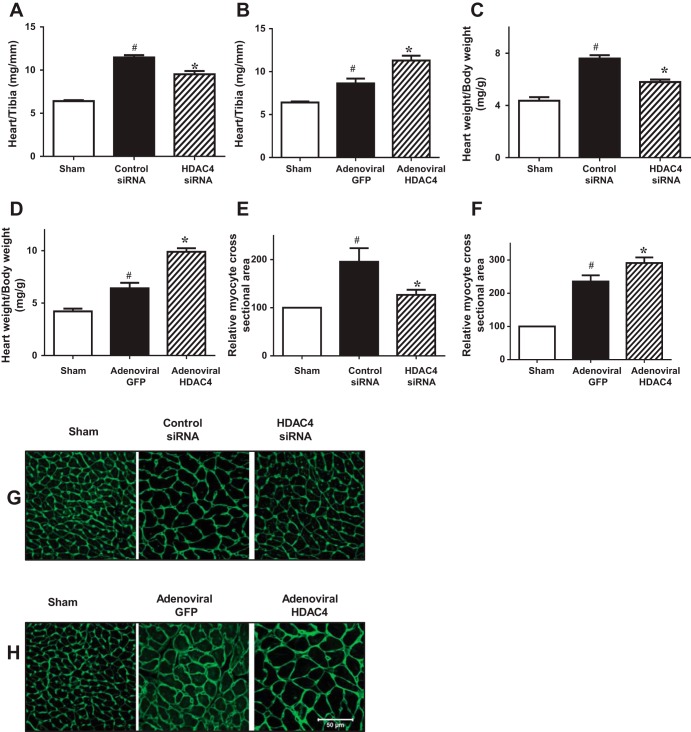
Fig. 6.
Effects of HDAC inhibition attenuate hypertrophic responses in c-kit+ CSC-engrafted MI hearts. A: quantitative analyses of heart/tibia length ratio in MI hearts that received c-kit+ CSCs transfected with control siRNA, HDAC4 siRNA, respectively. B: quantitative analyses of heart/tibia length ratio in MI hearts that received c-kit+ CSCs infected with adenoviral HDAC4 and adenoviral GFP. C: quantitative analyses of heart/body weight ratio in MI hearts that received c-kit+ CSCs transfected with control siRNA, HDAC4 siRNA, respectively. D: quantitative analyses of heart/body weight ratio in MI hearts that received c-kit+ CSCs infected with adenoviral HDAC4 and adenoviral GFP. E: relative myocyte areas were determined with WGA staining in MI hearts that received c-kit+ CSCs transfected with control siRNA, HDAC4 siRNA, respectively. F: relative myocyte areas were determined with WGA staining in MI hearts that received c-kit+ CSCs infected with adenoviral HDAC4 and adenoviral GFP. G: representative image of WGA in MI hearts that received c-kit+ CSCs transfected with control siRNA, HDAC4 siRNA, respectively. H: representative image of WGA in MI hearts that received c-kit+ CSCs infected with adenoviral HDAC4 and adenoviral GFP. Values represent means ± SE (n = 3 per group). *P < 0.05 vs. control siRNA; #P < 0.05 vs. sham in A, C, E; *P < 0.05 vs. adenoviral GFP; #P < 0.05 vs. sham in B, D, F. Scale bar represents 50 μm.

