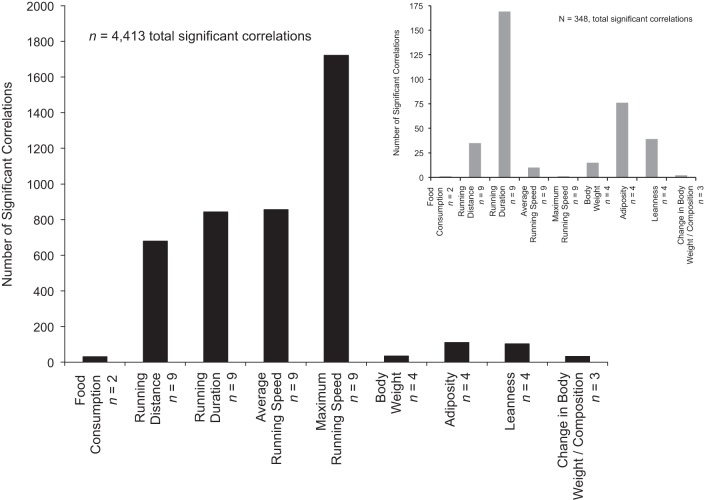
Fig. 1.
The number of statistically significant (P < 0.05, adjusted for multiple comparisons) partial correlations; adjusted for sex and parent of origin, factors with known phenotypic effects (see Ref. 23) between 17,571 significantly expressed transcripts, and exercise (n = 36) and body composition-related phenotypes (n = 17). For comparison, the number of significant partial correlations from expression data in brain tissue is inset (gray bars, Ref. 26).

