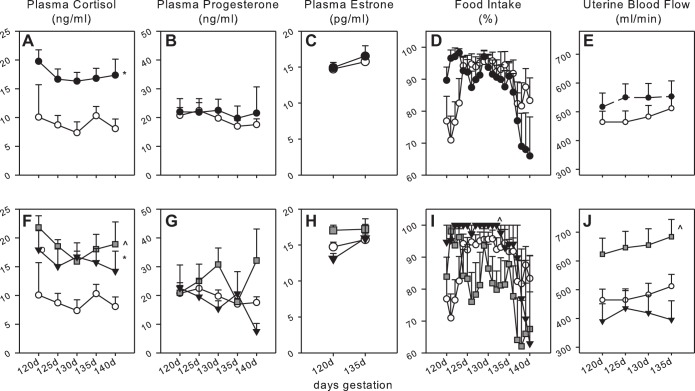
Fig. 2.
Plasma cortisol (A and F), progesterone (B and G), estrone (C and H), food intake (D and I), and uterine blood flow (E and J) in control ewes (○; n = 13) or ewes infused with cortisol (1 mg·kg−1·day−1 from 115 days to term; ●; A–E; n = 15). F–J: values in control and cortisol-treated ewes segregated by pregnancy outcome are shown. Cortisol-treated ewes delivering live lambs or with live lambs at the time of euthanasia (solid gray squares; n = 7) or those delivering stillborn lambs or with dead lambs at necropsy (▲; n = 8). Data are shown as means ± SE. *Significant overall differences between all cortisol-treated compared with control ewes (A–E) or ewes treated with cortisol with live lambs vs. control ewes (F–J). ^Significant overall difference between ewes with stillborn lambs vs. control ewes (F–J). Uterine flow data exclude 2 ewes in the control group with twins and two ewes in the cortisol-treated group with improper placement of the flow probe.

