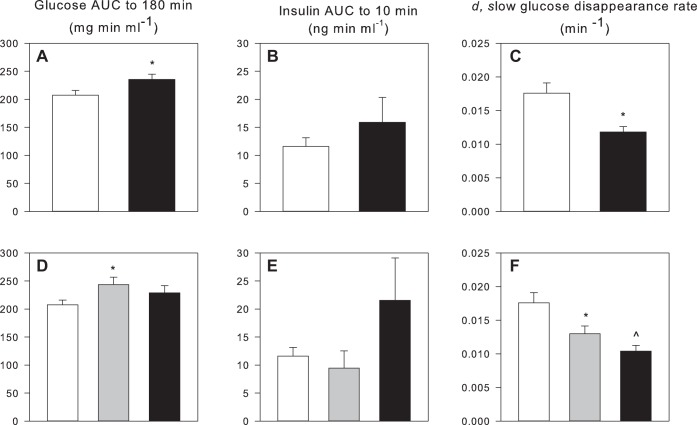
Fig. 5.
Total area under the curve (AUC) data for glucose to 180 min (A and D), for insulin to 10 min (B and E) and estimates of the slow glucose disappearance rate [parameter d of 5 parameter fit: y = y0+a·exp(−b·x)+c·exp(−d·x)]. (C and F). A–C: values from control ewes (white bars; n = 12) vs. all cortisol-infused ewes (black bars; n = 15). D–F: data with results in cortisol-infused ewes segregated by pregnancy outcome (gray bars, live fetuses at euthanasia or delivery, n = 7; black bars, stillborn, n = 8). Symbols to indicate significance are used as indicated in Fig. 2.

