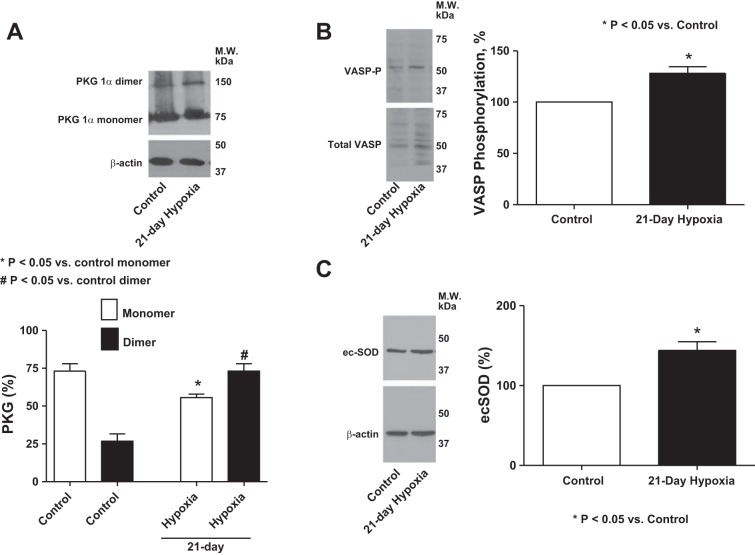
Fig. 3.
Western blot analysis showing the effects of exposure of mice to 21 days of hypoxia compared with a 21-day exposure to normoxia control on expression of PKG-dimerization (A) (n = 8). *P < 0.05 vs. control monomer. #P < 0.05 vs. control dimer. PKG monomer and dimer were analyzed as the % of total PKG after the total PKG was normalized to actin. B: VASP-phosphorylation (n = 8); *P < 0.05 vs. control and ecSOD (C) (n = 6); *P < 0.05 vs. control in mouse lung tissue.

